Bamber, J.L. et al. doi:10.5194/tc-7-499-2013
For an overview go here. For ice surface views, go here. For dual ice surface and bedrock views, go here.
No isostatic rebound included in the bedrock views. (When the ice melts, the earth beneath will rise as she is unburdened. This effect is not included in the bedrock depictions here.)
The following is a composite image of ice surface, ice velocity and bedrock, from left to right. Each is detailed below.
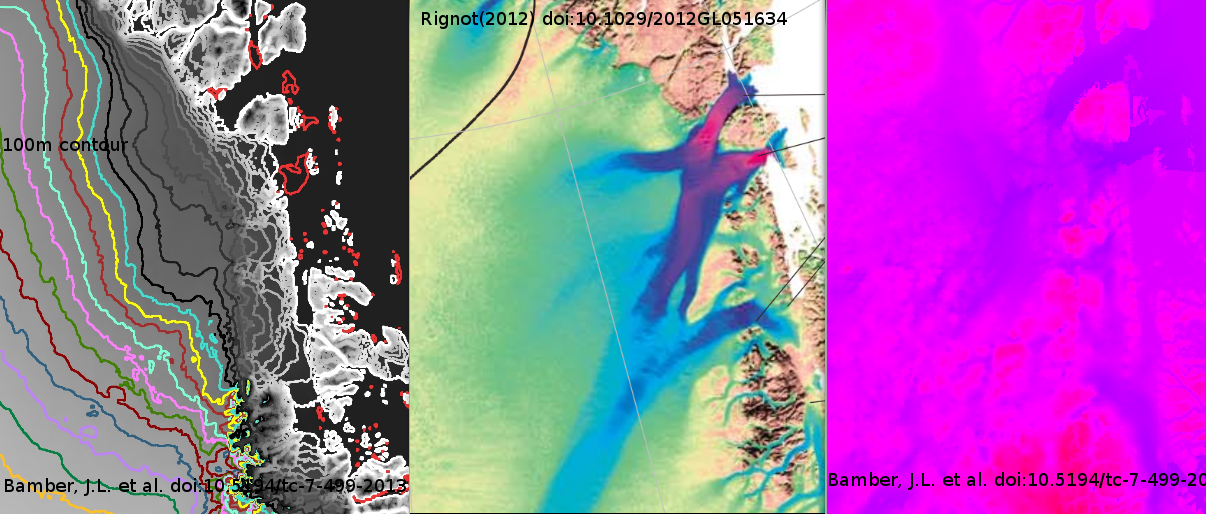
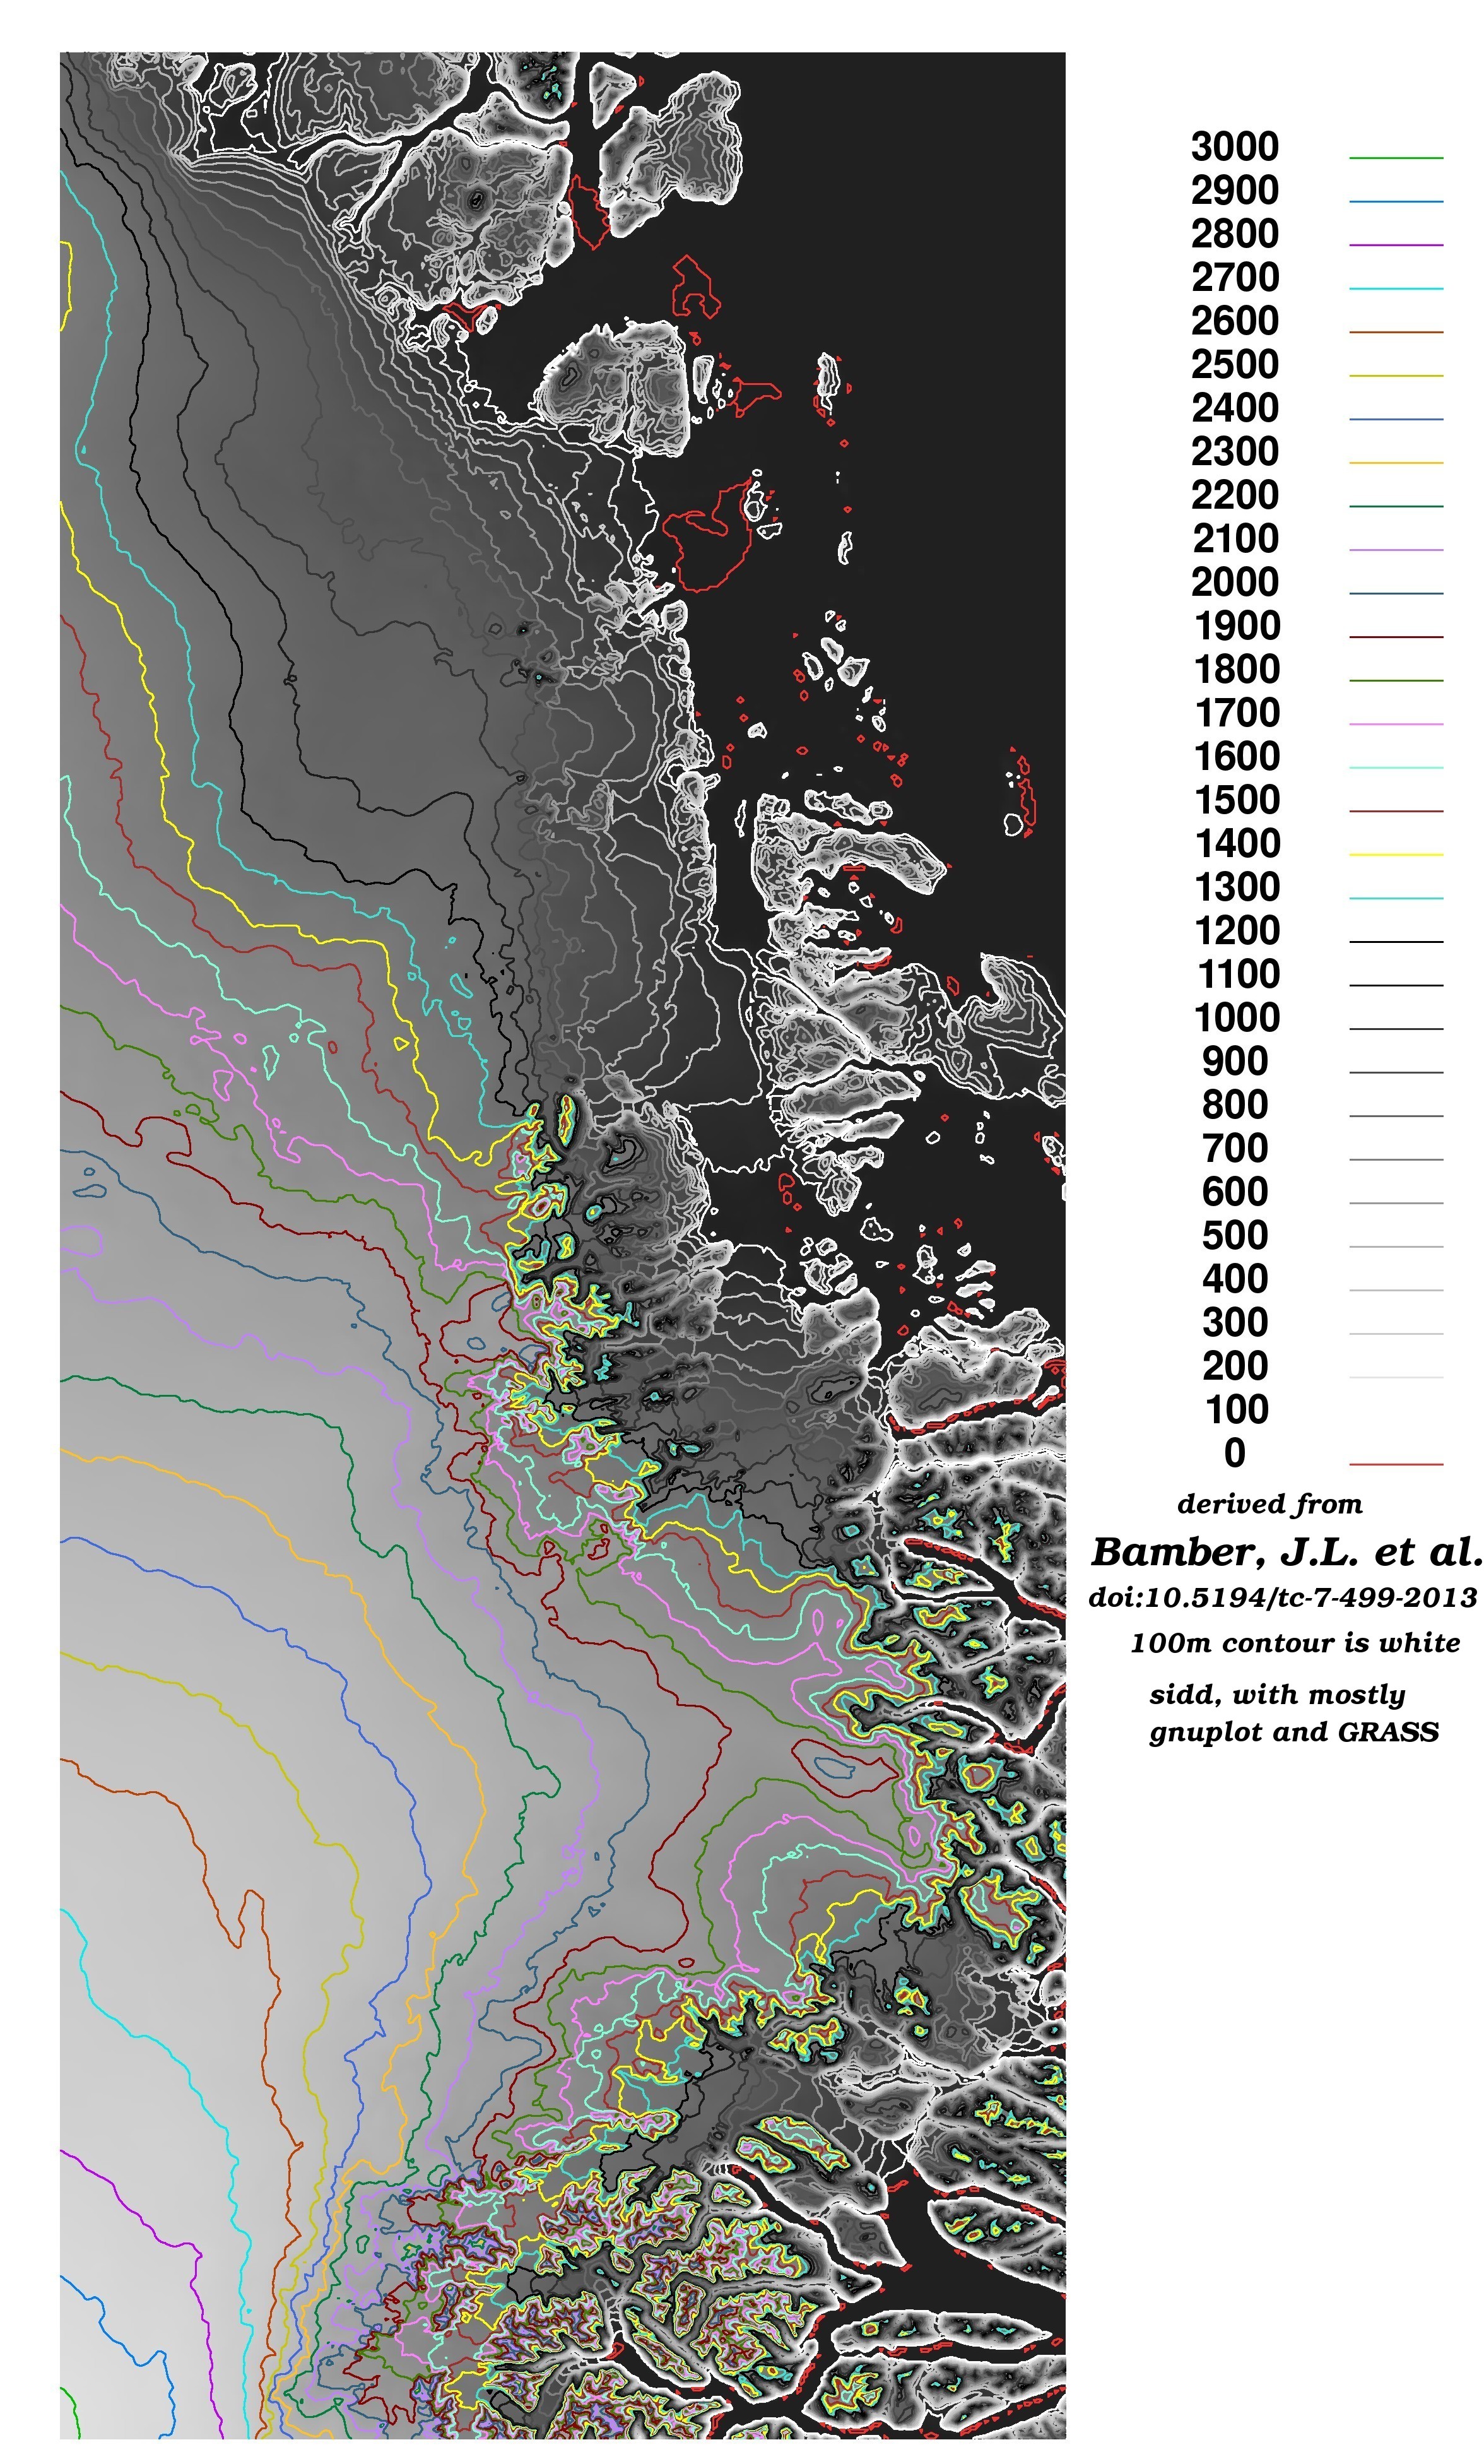
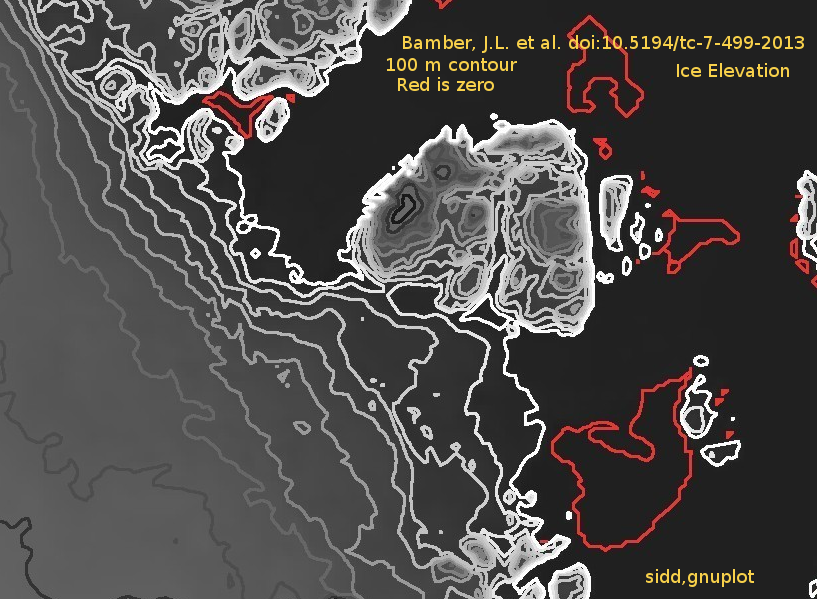
The following image is the 100m contours of the ice surface
Click on it for a link to a larger version.
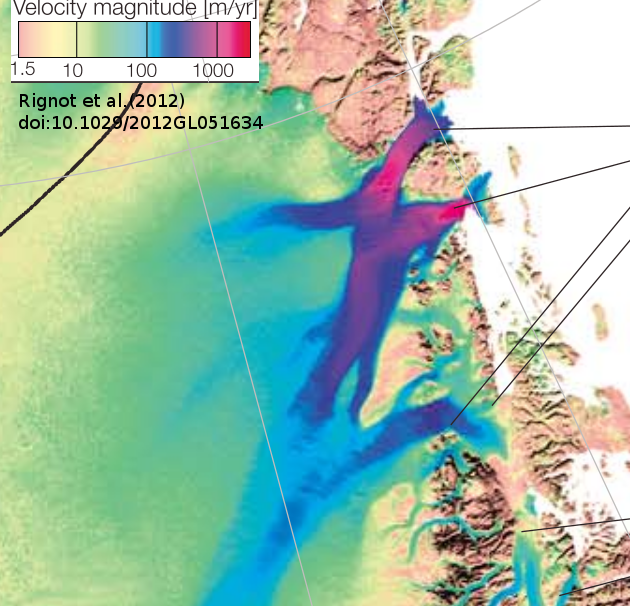
The following image is the velocity of the ice surface
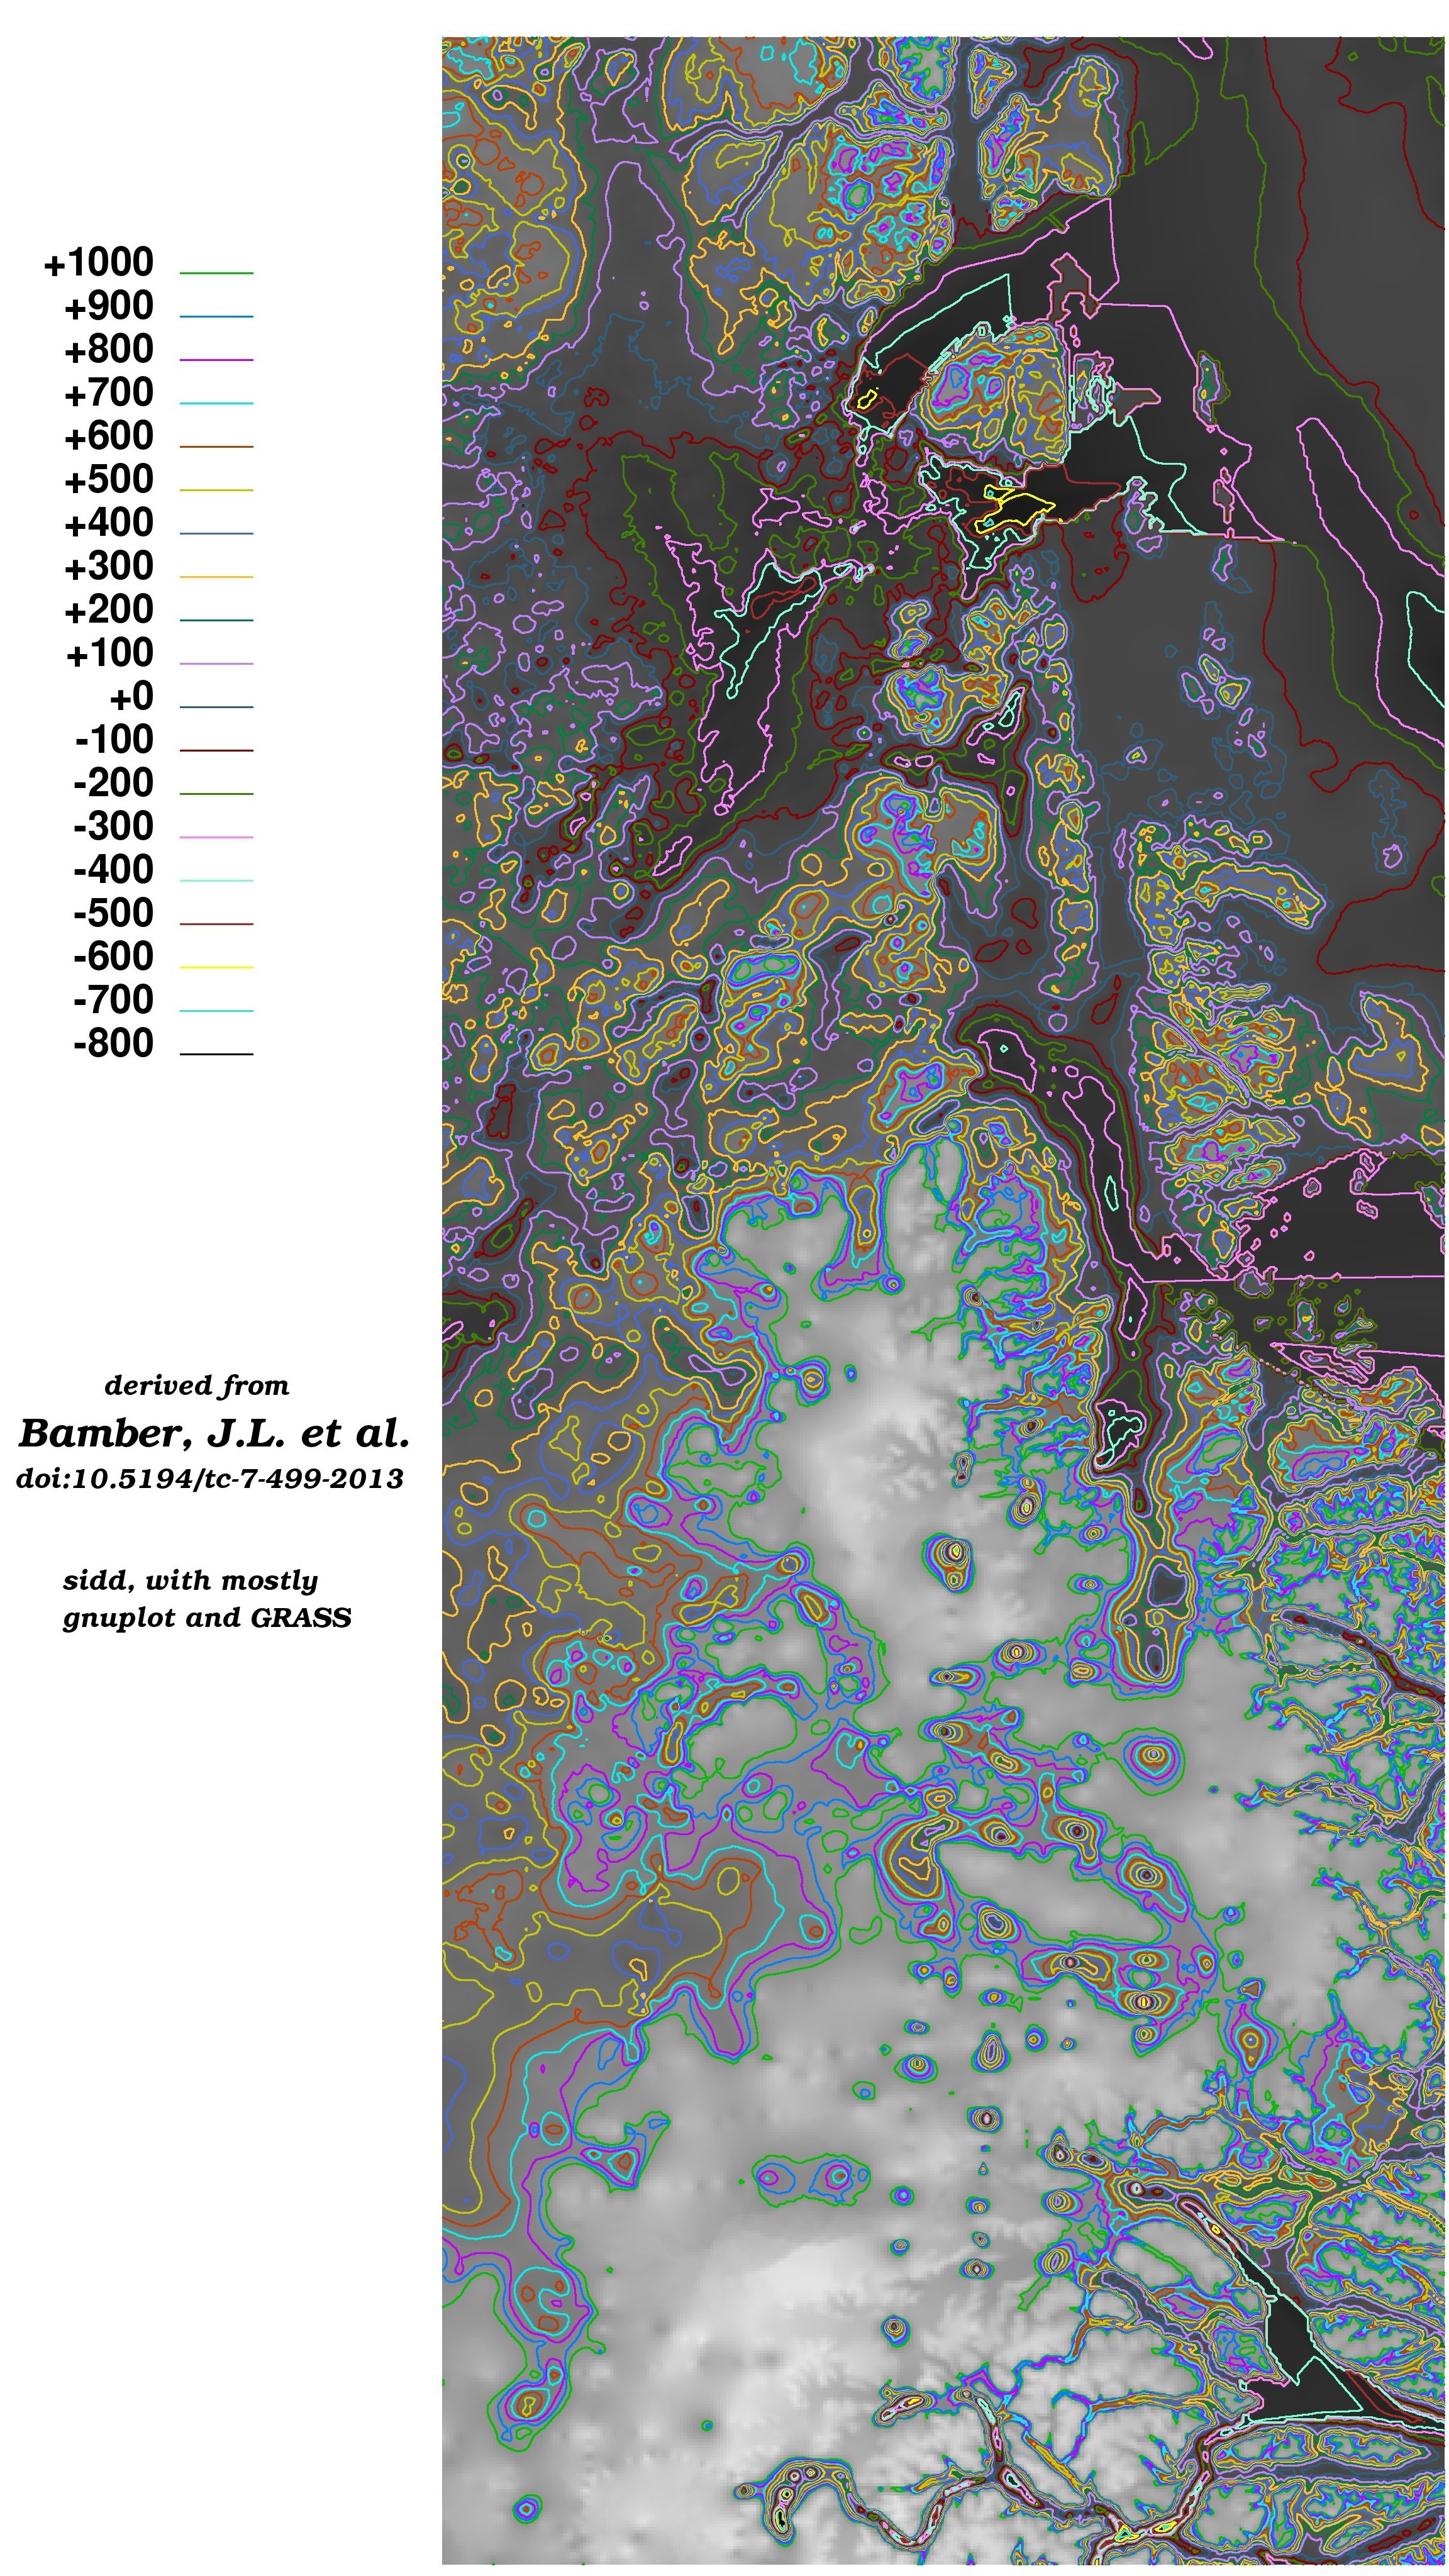
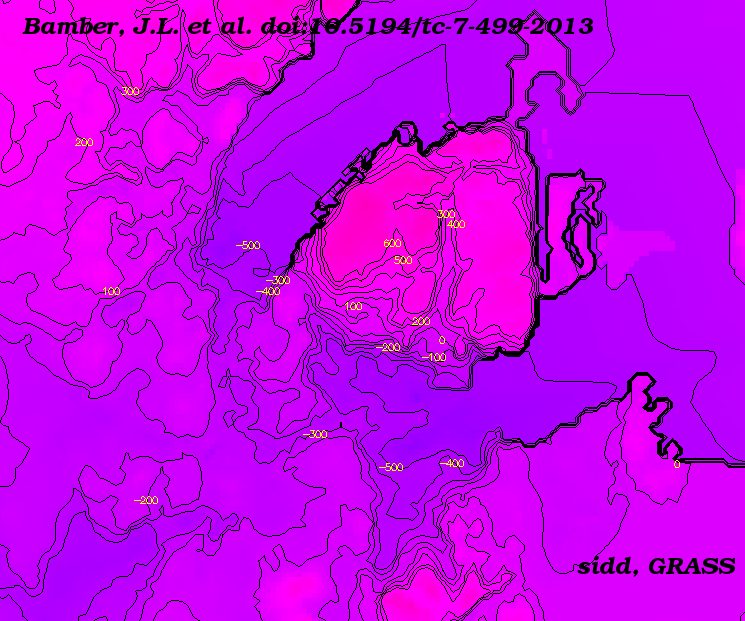
The following image is the bedrock below the ice
Click on it for a link to a larger version.
The following image is a close up of the bedrock below the ice below Nioghalvfjerdsfjorden and Zachariae Isstrom. Note that Zachariae is a wider and deeper connection to the future inland sea.
The following image is a close up of the ice surface along Nioghalvfjerdsfjorden and Zachariae Isstrom. Note that ice is piling up behind the first, but not the second. The warming ocean reaches deeper under Zachariae. Zachariae is a wider and deeper connection to the future inland sea. For discussion of the trough below Zachariae and inlets for Atlantic Intermediate water melting the base of the ice see here.
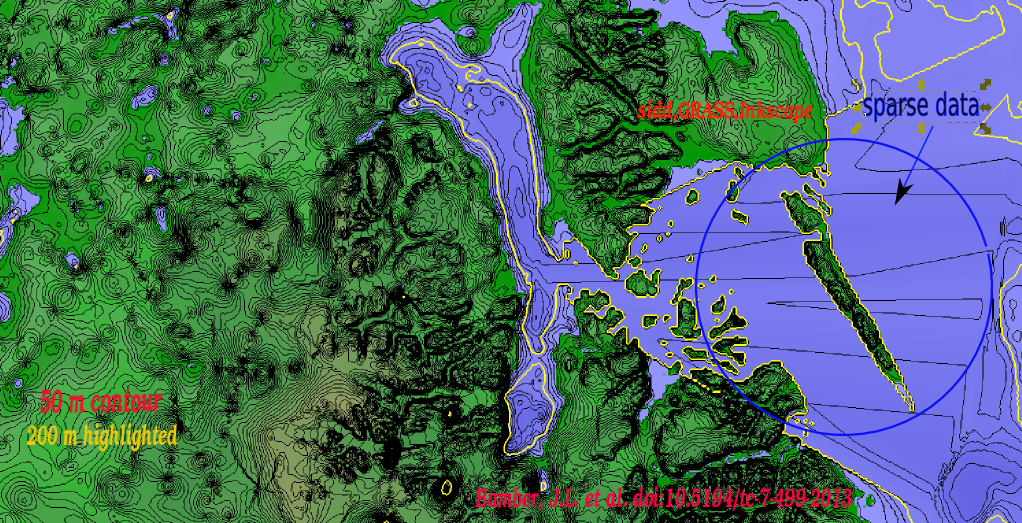
Bedrock below Dove Bugt, note the areas sparse bathymetry data where
the contours are suspiciously long and straight.
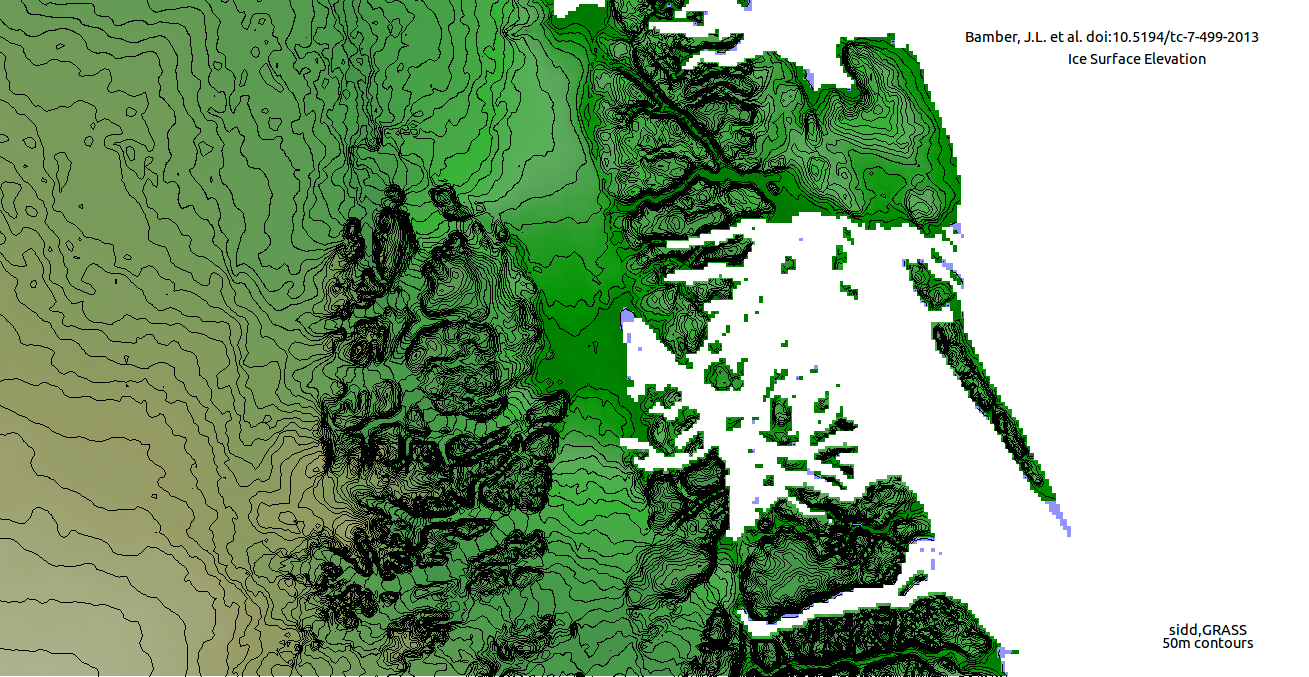
Surface ice contours of Storstrommen and L. Bistrup Brae
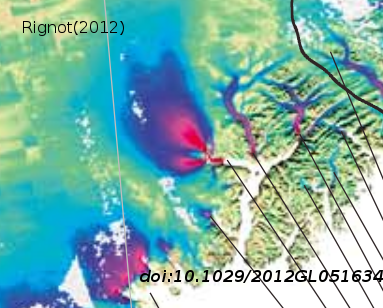
Here are some of Helheim. The first is the velocity from Rignot(2012)
doi:10.1029/2012GL051634
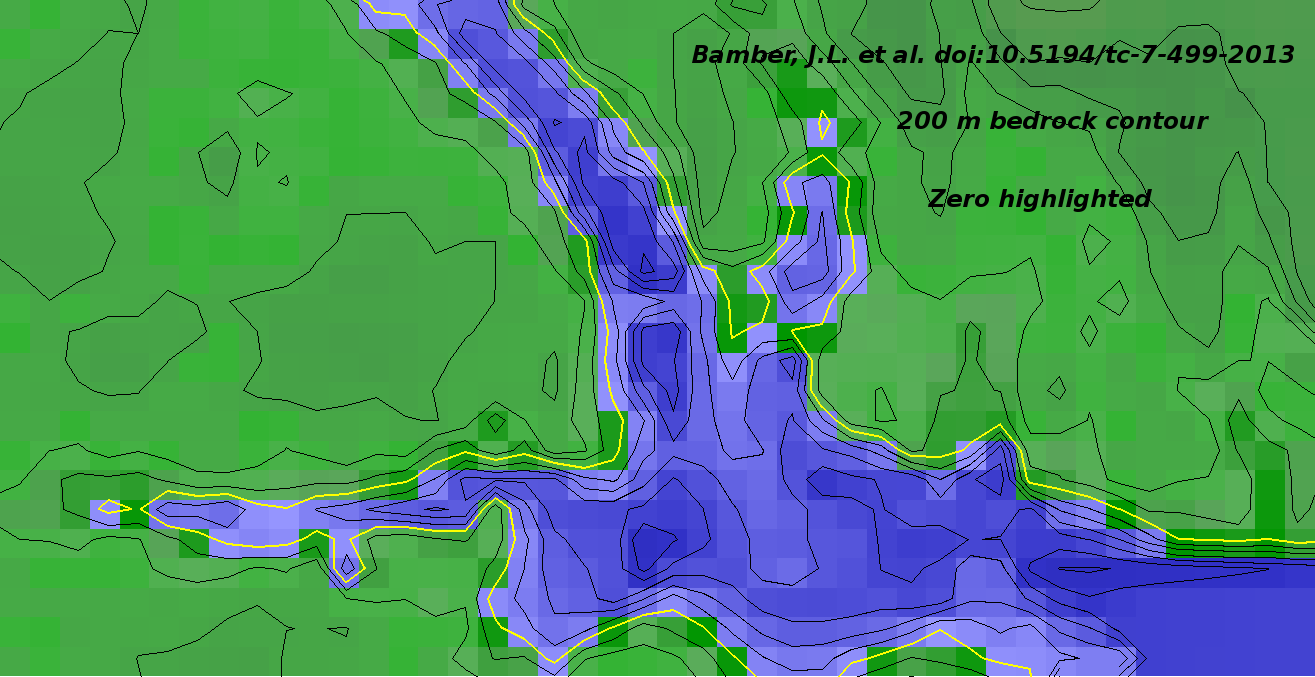
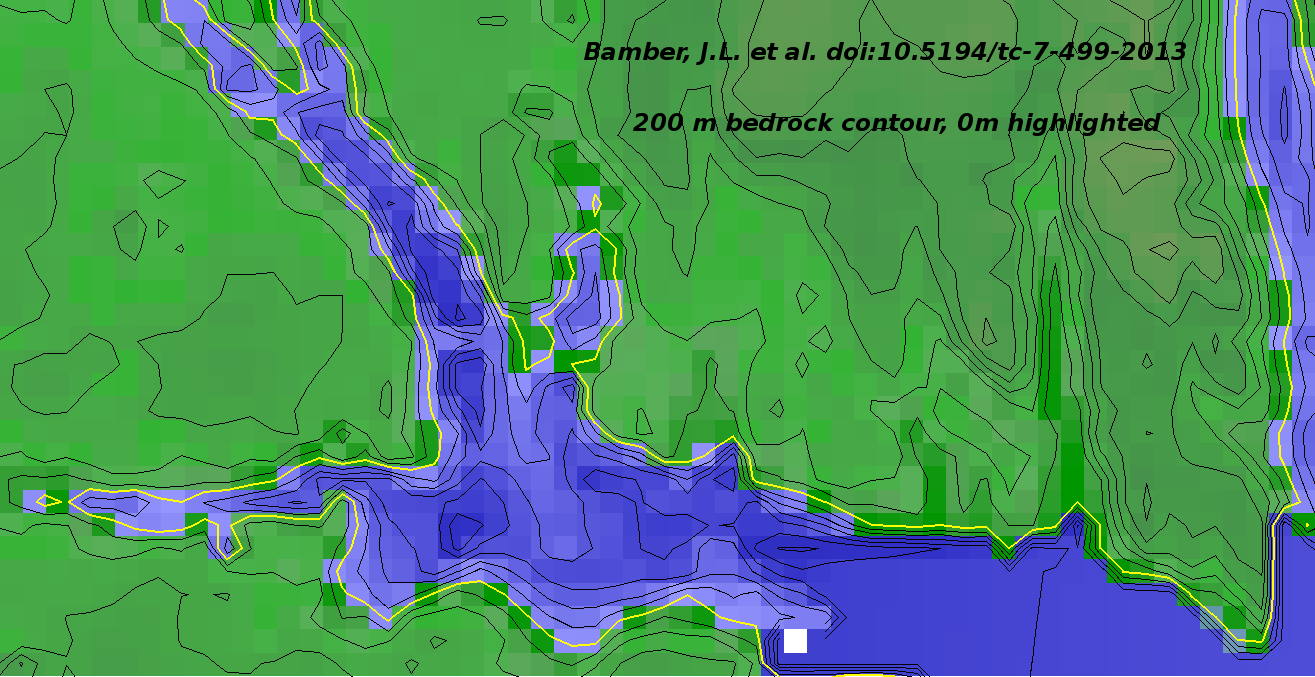
200 m bedrock contours.
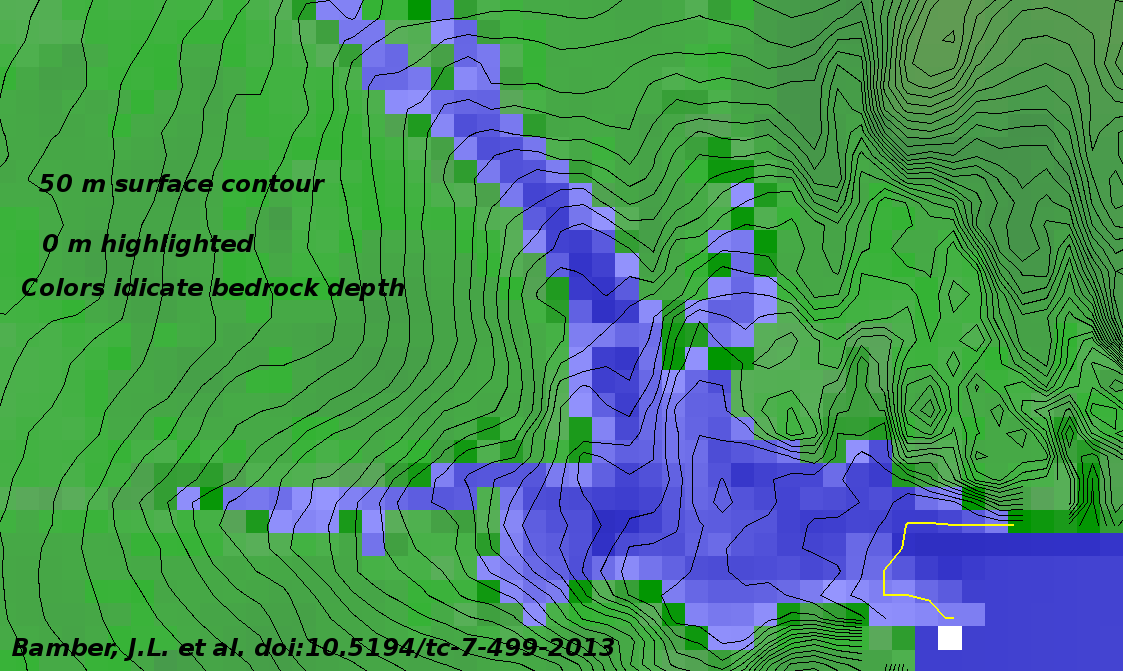
Ice surface contours on Helheim, overlaid over bedrock colors.
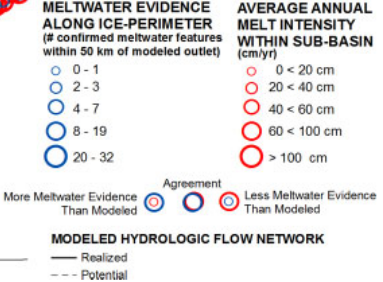
Here are some models of subsurface hydrology in NE Greenland from Lewis(2009) DOI: 10.1002/hyp.7343
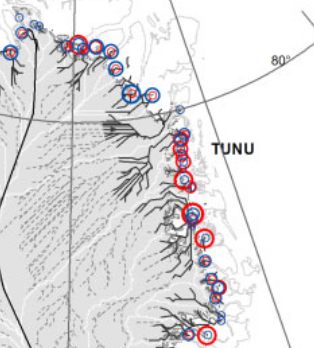
The following image is a key to the previous image
and
Livingstone(2013) doi:10.5194/tc-7-1721-2013 (open access)
For a comparison of ice surface and bedrock depth please see this page. For detail on a trough under Zachariae, see here
Return to Greenland 2013 Return to Science