Human Induced Climate Change Experiment

West Antarctica Melting

by Eric Steig

Regular followers of RealClimate will be aware of our publication in 2009 in Nature, showing that West Antarctica — the part of the Antarctic ice sheet that is currently contributing the most to sea level rise, and which has the potential to become unstable and contribute a lot more (3 meters!) to sea level rise in the future — has been warming up for the last 50 years or so.

Our paper was met with a lot of skepticism, and not just from the usual suspects. A lot of our fellow scientists, it seems, had trouble getting over their long-held view (based only on absence of evidence) that the only place in Antarctica that was warming up was the Antarctica Peninsula. To be fair, our analysis was based on interpolation, using statistics to fill in data where it was absent, so we really hadn’t proven anything; we’d only done an analysis that pointed (strongly!) in a particular direction.


It has been a strange couple of years in limbo: we have known with certainty for at least two years that our results were basically correct, because there was a great deal of very solid corroborating evidence, including the borehole temperature data that confirmed our basic findings, and data from automatic weather stations near the center of West Antarctica that we hadn’t used, but which Andy Monaghan at Ohio State (now NCAR) had shown also corroborated our results. But most of this work was unpublished until very recently, so it wasn’t really usable information.

So it was a nice early Christmas present to see the publication of a new assessment by the well-known guru of Antarctic meteorology, David Bromwich, along with his students and colleagues at Ohio State, the University of Wisconsin (who run the U.S. automatic weather station program in Antarctica) and NCAR, which back up our results. Actually, they do more than back-up our results: they show that our estimates were too conservative and that West Antarctica is actually warming by about a factor of two more than we estimated. They also agree with the key interpretation of the results that both we and David Schneider and colleagues at NCAR have presented: that in the winter and spring seasons, when the most rapid warming is occurring in West Antarctica, the driver has been changes in the tropical Pacific, not the ozone hole (which is invoked too frequently, in my view, to explain everything from penguin populations to sea ice changes).

The borehole temperature data were published earlier this year by Orsi et al. in Geophysical Research Letters. The new temperature reconstruction of Monaghan was included as part of a paper (Küttel et al.) on ice core records in Climate Dynamics, also earlier this year; it was also included in the reconstruction in Schneider et al. 2011 in Climate Dynamics. Both showed unambiguously that West Antarctic is warming up, as fast as the Antarctic Peninsula. Bromwich et al. gets this same result again.

If it sounds like I don’t think Bromwich et al.’s results are anything new, let me correct that impression. The contribution of this new paper is huge. Bromwich et al. rely almost entirely on local data to produce the best-possible record of temperature from one location — Byrd Station in central West Antarctica. In contrast, our work relied heavily on interpolation of data from weather stations some distance from West Antarctica. Why didn’t we use the same data Bromwich et al. did? Well, we did, but the problem is that the Byrd Station record is actually several different records, taken at different times using different instruments. We felt that we could not splice these records together into one continous record, because instrument inter-calibration issues could easiily create spurious trends.

One of the chief contributions of the Bromwich team is that they carefully checked the calibration on the various temperature sensors and dataloggers that are used in the Byrd automatic weather station. It turns out that there were significant calibration issues and that correcting for them makes the temperature higher in the 1990s but somewhat lower in the 2000s (though still higher than in the 1960 – 1980s). That is a compelling finding, because it puts the weather station data in better agreement with the climate forecast reanalysis data explaining the cause of the winter warming trends (as described e.g. in Ding et al., 2011; 2012).

Another new aspect of the Bromwich et al. paper is that it shows that there is significant warming even in summer time in West Antarctica. This could arguably bode ill for the West Antarctic Ice Sheet, since if current trends continue it will mean more melting on the ice shelves there — ultimately leading to their collapse, as has already happened on the Antarctic Peninsula.

As Anais Orsi and I discuss in a News & Views article — not yet online, but evidently to be in the Februrary print issue of Nature Geoscience — Bromwich et al.’s results are objectively the best record available of the last five decades of temperature change in West Antarctica. Note that the while the borehole data are the most important independent validation, they provide only a smoothed look at past temperatures; they do not resolve interannual or decadal variability. Bromwich et al.’s updated record for Byrd Station should now be routinely incorporated into global temperature compilations such as those done by GISS and CRU. Doing so will, I think, change the picture of climate change in the Southern Hemisphere, and not insignificantly.

There’s a lot more to be said — including some reasons why I don’t think the likelihood of surface-snow-melt-driven collapse of ice shelves is very high in West Antarctica — but I’m off to enjoy a respite from the internet for a few days. I’m going somewhere nice and cold and snowy.

Happy Holidays to all.

Reading materials, with links, below.

  • Bromwich, D. H. et al. Central West Antarctica among most rapidly warming regions on Earth, Nat. Geosci.(2012).
  • Ding, Q., Steig, E. J., Battisti, D. S. & Kuttel, M. Winter warming in West Antarctica caused by central tropical Pacific warming. Nat. Geosci. 4, 398-403, doi:10.1038/ngeo1129 (2011).
  • Ding, Q., Steig, E. J., Battisti, D. S. & Wallace, J. M. Influence of the tropics on the Southern Annular Mode. J. Climate 25, 6330-6348 doi:10.1175/JCLI-D-11-00523.1 (2012).
  • Küttel, M., Steig, E. J., Ding, Q., Battisti, D. S. & Monaghan, A. J. Seasonal climate information preserved in West Antarctic ice core water isotopes: relationships to temperature, large-scale circulation, and sea ice. Clim. Dyn. 39, 1841-1857, doi:10.1007/s00382-012-1460-7 (2012).
  • Orsi, A. J., Cornuelle, B. D. & Severinghaus, J. P. Little Ice Age cold interval in West Antarctica: Evidence from borehole temperature at the West Antarctic Ice Sheet (WAIS) Divide. Geophys. Res. Lett. 39, L09710, doi:10.1029/2012gl051260 (2012).
  • Schneider, D. P., Deser, C. & Okumura, Y. An assessment and interpretation of the observed warming of West Antarctica in the austral spring. Clim. Dyn. 38, 323-347, doi:10.1007/s00382-010-0985-x (2011).
  • Schneider, D. P. & Steig, E. J. Ice cores record significant 1940s Antarctic warmth related to tropical climate variability. Proceedings of the National Academy of Sciences 105, 12154-12158, doi:10.1073/pnas.0803627105 (2008).
  • Steig, E. J., Ding, Q., Battisti, D. S. & Jenkins, A. Tropical forcing of Circumpolar Deep Water Inflow and outlet glacier thinning in the Amundsen Sea Embayment, West Antarctica. Annal. Glaciol. 53, 19-28, doi: 10.3189/2012AoG60A110 (2012).
  • Steig, E.J., Schneider, D.P. Rutherford, S.D., Mann, M.E., Comiso, J.C., Shindell, D.T. Warming of the Antarctic ice-sheet surface since the 1957 International Geophysical Year. Nature 457, 459-462, doi:10.1038/nature07669 (2009).
Posted in Uncategorized | Tagged , , , , , , , , , , | Comments closed

Which Witch?

Earthrise 1968

Earthrise 1968

USA, EARTH — Can you remember which witch said, “I’m melting”?
A: That would be the Wicked Witch of the West

Do you know which witch said, “I’m melting Twice as Fast as Previously Thought”?
A: That would be you and me.

On December 24, 1968 the first color photograph of the world was seen. It became a symbol for the environmental movement.

On December 24. 2012 the National Science Foundation said:

Study Finds That Portions of the West Antarctic Ice Sheet Are Warming Twice as Fast as Previously Thought

Findings could have important implications for global sea-level rise

A graphic showing the relative Antarctic  warming
This graphic shows the relative warming near Byrd Station.
Credit and Larger Version

December 24, 2012

A new study funded by the National Science Foundation (NSF) finds that the western part of the massive West Antarctic Ice Sheet (WAIS) is experiencing nearly twice as much warming as previously thought.

The findings were published online this week in the journal Nature Geoscience. NSF manages the U.S. Antarctic Program (USAP) and coordinates all U.S. research and associated logistics on the southernmost continent and in the surrounding Southern Ocean.

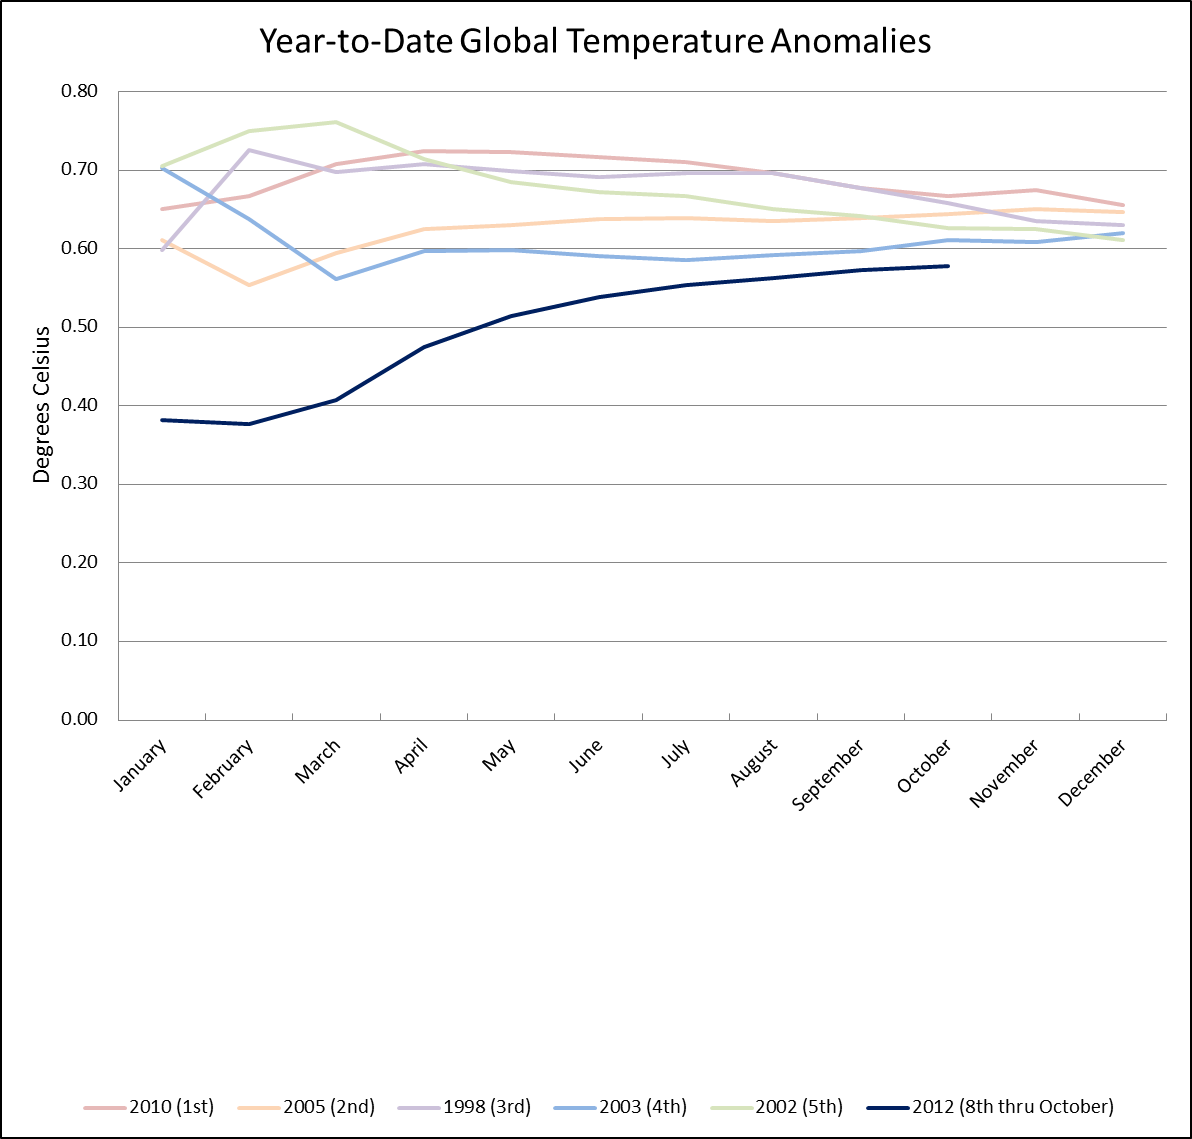
The temperature record from Byrd Station, an unmanned scientific outpost in the center of the ice sheet, demonstrates a marked increase of 4.3 degrees Fahrenheit (2.4 degrees Celsius) in average annual temperature since 1958. That is three times faster than the average temperature rise around the globe.

This temperature increase is nearly double what previous research has suggested, and reveals–for the first time–warming trends during the summer months of the Southern Hemisphere (December through February), said David Bromwich, professor of geography at Ohio State University and senior research scientist at the Byrd Polar Research Center.

“Our record suggests that continued summer warming in West Antarctica could upset the surface mass balance of the ice sheet, so that the region could make an even bigger contribution to sea-level rise than it already does,” said Bromwich.

“Even without generating significant mass loss directly, surface melting on the WAIS could contribute to sea level indirectly, by weakening the West Antarctic ice shelves that restrain the region’s natural ice flow into the ocean.”

Andrew Monaghan, study co-author and scientist at the National Center for Atmospheric Research (NCAR), said that these findings place West Antarctica among the fastest-warming regions on Earth.

“We’ve already seen enhanced surface melting contribute to the breakup of the Antarctic’s Larsen B Ice Shelf, where glaciers at the edge discharged massive sections of ice into the ocean that contributed to sea level rise,” Monaghan said. “The stakes would be much higher if a similar event occurred to an ice shelf restraining one of the enormous WAIS glaciers.”

Researchers consider the WAIS especially sensitive to climate change, explained Ohio State University doctoral student Julien Nicolas. Since the base of the ice sheet rests below sea level, it is vulnerable to direct contact with warm ocean water. Its melting currently contributes 0.3 mm to sea level rise each year–second to Greenland, whose contribution to sea-level rise has been estimated as high as 0.7 mm per year.

Due to its location some 700 miles from the South Pole and near the center of the WAIS, Byrd Station is an important indicator of climate change throughout the region.

In the past, researchers haven’t been able to make much use of the Byrd Station measurements, due to the fact that since the station was establishment in 1957, it hasn’t always been occupied. So, its data were incomplete, to the point that nearly one third of the temperature observations were missing for the time period of the study. A year-round automated station was installed in 1980, but it has experienced frequent power outages, especially during the long polar night, when its solar panels can’t recharge.

Bromwich and two of his graduate students, along with colleagues from the National Center for Atmospheric Research and the University of Wisconsin-Madison, corrected the past Byrd temperature measurements and used corrected data from a computer atmospheric model and a numerical analysis method to fill in the missing observations.

Aside from offering a more complete picture of warming in West Antarctica, the study suggests that if this warming trend continues, melting will become more extensive in the region in the future, Bromwich said.

While the researchers work to fully understand the cause of the summer warming at Byrd Station, the next step is clear, he added.

“West Antarctica is one of the most rapidly changing regions on Earth, but it is also one of the least known,” he said. “Our study underscores the need for a reliable network of meteorological observations throughout West Antarctica, so that we can know what is happening–and why–with more certainty.”

-NSF-

Media Contacts
Peter West, NSF (703) 292-7530 pwest@nsf.gov
Pam Frost Gorder, Ohio State University (614) 292-9475 Gorder.1@osu.edu

Principal Investigators
David Bromwich, Ohio State University / Byrd Polar Research Center (614) 292-6692 Bromwich.1@osu.edu
Andrew Monaghan, National Center for Atmospheric Research (NCAR) 303) 497-8424 monaghan@ucar.edu

The National Science Foundation (NSF) is an independent federal agency that supports fundamental research and education across all fields of science and engineering. In fiscal year (FY) 2012, its budget is $7.0 billion. NSF funds reach all 50 states through grants to nearly 2,000 colleges, universities and other institutions. Each year, NSF receives over 50,000 competitive requests for funding, and makes about 11,000 new funding awards. NSF also awards nearly $420 million in professional and service contracts yearly.

 Get News Updates by Email 

Useful NSF Web Sites:
NSF Home Page: http://www.nsf.gov
NSF News: http://www.nsf.gov/news/
For the News Media: http://www.nsf.gov/news/newsroom.jsp
Science and Engineering Statistics: http://www.nsf.gov/statistics/
Awards Searches: http://www.nsf.gov/awardsearch/

Posted in Uncategorized | Tagged , , , , , , , , , , , , , , , , | Comments closed

Wildfires

Overview

During November, the year-to-date pattern for incidents of fewer fires with larger size continued. The year-to-date total of 55,505 fires was the least since records began in 2000 for any January through November period. Whereas, the year-to-date average fire size was the most since 2000 for any January through November period, with the year-to-date total acreage burned being the 2nd highest since 2000. The monthly total number of 3,694 fires was the 5th most for November in the thirteen-year record. November’s average fire size and monthly total acres burned both ranked at the median value (7th highest and 7th lowest) for any November in the 2000-2012 record. The monthly average fire size reached 41.3 acres per fire, which was well below the 10-year average (based on 2001-2010) of 71.4 acres per fire. The January through November average fire size was 165.0 acres. Over 150,000 acres burned by wildfires in November, with a total of 9.1 million acres having burned since January 2012.

Monthly Wildfire Statistics*
November Rank
(out of 13 years)
Record 10-Year Average
(2001-2010)
Value Year
Acres Burned 152,697 7th Most 478,648 2003 184,808.8
7th Least
Number of Fires 3,694 5th Most 10,223 2001 3,620.3
9th Least
Acres Burned/Fire 41.3 7th Most 227 2003 71.4
7th Least
Seasonal Wildfire Statistics*
September–
November
Rank
(out of 13 years)
Record 10-Year Average
(2001-2010)
Value Year
Acres Burned 1,431,323 4th Most 1,992,436 2007 1,012,094.2
10th Least
Number of Fires 10,981 10th Most 22,843 2001 14,175.8
4th Least
Acres Burned/Fire 130.3 3rd Most 176 2006 79.7
11th Least
Year-to-Date Wildfire Statistics*
January–
November
Rank
(out of 13 years)
Record 10-Year Average
(2001-2010)
Value Year
Acres Burned 9,156,278 2nd Most 9,508,251 2006 6,346,769.6
12th Least
Number of Fires 55,505 13th Most 91,094 2000 72,115.7
Least on Record
Acres Burned/Fire 165.0 Most on Record 165 2012 88.5
13th Least

*Data Source: The National Interagency Fire Center (NIFC)

Discussion

As exceptional drought remained anchored over the central Great Plains, dryness expanded into central North Carolina and Virginia from a second location of exceptional drought centered over Georgia during November. In early November, the moisture deficits mounted across Georgia and South Carolina (Keetch-Byram Drought Index values exceeded 500 units), before mid-month showers brought brief improvement. Dryness spread from western and central Kentucky to dip across northeastern Tennessee by the end of the month, where an outbreak of wildfire incidents resulted. Drought conditions intensified in eastern Oklahoma, and northern and southeastern Texas. Severe drought expanded in southwestern Nevada and southeastern California in the latter half of November. Although the east-facing slopes of the Hawaiian islands received precipitation from mid-month onward, the western areas continued to experience drought.

Significant Events


Please note, this is a list of select fires that occurred during November. Additional fire information can be found through Inciweb.


California

Precipitation across southern California remained below-normal during November. The ongoing dryness in wind-prone areas provided conditions for significant fire potential. Multiple wildfires burned during the month. The Devore Fire ignited on November 5th in the chaparral along Interstate 15, which resulted in the day-long closure of the highway through Cajon Pass. Santa Ana winds fanned the blaze quickly through more than 330 acres in the foothills of the San Bernardino Mountains. Three residences near the Mathews Ranch were evacuated, but no damage was reported. Over 450 firefighters with the support of 10 aircraft contained the wildfire on November 6th. The following week the Cut Fire sparked in the same area, but was contained after charring about 4 acres on November 11th. The wildfire also forced a brief closure of one northbound lane of Interstate 15 for a few hours. Off-shore winds, which strengthened unexpectedly, drove a prescribed 430-acre burn in Montana de Oro State Park outside of containment to become a wildfire on November 13th. The Creek Fire burned an additional 100 acres of brush and hardwoods before being controlled on November 15th. The Ranch Fire, which ignited on November 25th to the northeast of San Bernardino near Apple Valley, caused the evacuation of the Horse Springs Campground. The wildfire was contained the next day after scorching 10 acres of grass and chaparral.

Hawaii

Westward portions of several Hawaiian islands had above-normal significant fire potential during November. A couple of wildfires developed on Oahu’s southern coast at mid-month where dry conditions and uncontrolled vegetation provided fuel, according to media reports. A wildfire at Ewa Beach burned about 100 acres and threatened residences on November 10th. Firefighting efforts were hampered due to the lack of fire hydrants. Another wildfire sparked the same day near Kalaeloa, which burned about 35 acres of dry brush without posing a threat to homes.

Monthly Wildfire Conditions

Wildfire information and environmental conditions are provided by the National Interagency Fire Center (NIFC) and the U.S. Forest Service (USFS) Wildland Fire Assessment System (WFAS).

Early in the month, only a few large wildfires formed and their locations coincided with the low 10-hour fuel moistures (at or below 10 percent) in southeastern Kentucky, southeastern Oregon, and southern California. In Kentucky, the Cave Branch Fire consumed over 200 acres. In Oregon, the Juniper Creek Fire consumed 1,500 acres of brush and grass. Critically low 10-hour fuel moistures (under 5 percent) spanned the Four Corners area of the southwest United States. Moreover, the lower half of the country experienced 10-hour fuel moistures at or below 8 percent. Both the 100-hour and 1000-hour fuel moistures were at or below 10 percent from Nevada to New Mexico, with most areas west of the High Plains at or below 15 percent, except for the Pacific Northwest and northern California.


Fuel moistures generally improved at all intervals (10-hour, 100-hour, and 1000-hour) from precipitation received during the second and third weeks of November, except in the Northeast. At mid-month, only southern Arizona and southern New Mexico’s fuel moistures remained below 5 percent for the 10-hour interval. As 10-hour fuel moistures dropped across the middle and northern Atlantic states, an increase in wildfire activity occurred in the southern Appalachian Mountains. Wildfires erupted in North Carolina, northeastern Tennessee, southeastern Kentucky, and western Virginia. Pilot Mountain Fire in North Carolina, which began as a prescribed 200-acre burn to clear dead wood and underbrush, tripled in size on November 8th when strong winds spread the blaze along the Jomeokee Trail. The fire’s low intensity spared standing trees, but forced closure of the Pilot Mountain State Park where other than for some burned fences at viewing areas no structural losses occurred, according to media reports. The fire was contained at 675 acres and the park reopened on November 21st. The Spade wildfire burned over 800 acres in Virginia’s Jefferson National Forest (northwest of Roanoke) and threatened homes from November 13th-15th. Another Virginia wildfire, the 3 Fingers Fire, burned about 100 acres from November 10th-15th.


During the latter part of November, the 10-hour and 100-hour fuel moistures remained at or below 15 percent in the Piedmont plateau regions of the eastern U.S. (parts of central Virginia, western and central North Carolina, upstate South Carolina, and northeast Georgia). In northern Georgia, a wildfire in the Chattahoochee-Oconee National Forest burned over 200 acres. The blaze, which sparked on November 25th, forced a temporary closure to the Appalachian Trail. In North Carolina, the High Eagle fire burned over 150 acres in the rugged terrain of Caldwell County near Lenoir before being contained on November 28th, according to media reports. Large wildfires continued to develop in eastern Tennessee, Kentucky and northern Arkansas. The Stone Mountain Fire consumed over 2,000 acres of beetle-killed pines in steep terrain of east Tennessee, while fanned by a northeasterly wind. The blaze burned west of Rogersville from November 15th-24th where it had threatened homes and structures in Hawkins County, according to media reports. Multiple wildfires sparked across eastern Kentucky in late November. The Turkey wildfire burned nearly 600 acres in the Daniel Boone National Forest from November 22nd-27th. The Belles Fork Fire burned nearly 250 acres. The Lime Kiln Fire burned nearly 170 acres from November 18th-20th. The Meathouse Fire burned up to 150 acres. Northwestern Arkansas remained under a moderate fire risk following a summer of hot temperatures and drought conditions, which dried the soil and fine fuels. The Snowball Fire consumed over 300 acres by November 23rd. Gusty winds, fallen leaves, warm temperatures, and low humidity at the end of November combined to keep the fire danger elevated in northwestern Arkansas and eastern Oklahoma.

In central Texas, preparations for the first volunteer planting workday at the Bastrop State Park occurred during November, according to media reports. Most of the 6,600-acre park’s signature “Lost Pines” were destroyed during the 2011 fires — deemed as the most destructive wildfires in the state’s history after devastating more than 32,000 acres. Drought-hardy loblolly pine seedlings were nurtured during the past year from over 1,000 pounds of surplus seeds in refrigerated storage. Over 400,000 seedlings were delivered to the park for the planting event commencing on December 1st. The seeds were collected as part of cooperative efforts between five states and eight industrial partners — led by the Texas A&M Forest Service — to promote the best genetic quality seed for use in forest regeneration programs in the Western Gulf Region of the United States. Planting of more than one million seedlings is planned for each of the two next years. Geneticists estimated that the 10-inch tall seedlings need up to 25 years to reach the mature size of the former Bastrop Lost Pines.

Posted in Uncategorized | Tagged , , , , , , | Comments closed

Global Warming Gets Cold Reception

(DOHA/ WASHINGTON – Dec. 8, 2012) After another marathon negotiating session, countries at the UN climate talks in Doha managed to scrape together minimal progress on its scope of work and agreed to begin addressing the hardships that climate change is already inflicting on the most vulnerable countries, but left a number of lingering issues unresolved, Environmental Defense Fund (EDF) said at the conclusion of the talks Saturday evening.

Working through long nights, delegates ultimately agreed to a three-part deal: i) a second round of emission reduction commitments under the Kyoto Protocol; ii) the close of the “LCA” negotiating track, which — since launched in Bali in 2007 — has led many countries to make voluntary emission reduction pledges; and iii) a course for negotiating the “Durban Platform for Enhanced Action” (ADP), a new climate deal for all countries to be agreed by 2015 and to take effect in 2020.

“With the unfinished business of the Kyoto Protocol and the Bali agenda finally behind them, countries can now face forward and concentrate on crafting the robust new agreement that we so urgently need,” said EDF’s International Climate Program Director Jennifer Haverkamp.

As predicted, a large sticking point across the negotiations was climate finance. Seeking firm commitments and clarifications of how financing would scale up between now and the $100 billion a year by 2020, as they were promised in Copenhagen, developing countries instead got a workplan and reassurances. The talks’ modest outcome also failed to send the policy signal needed to unlock critical private investments in climate change.

“Not until we get clarity on how all countries will participate in reducing emissions, and on the legal structure of the agreement and its institutions, will we see substantial funds flowing to address climate change, both inside and out of the UN process. Doha barely began to answer some of those questions,” said Haverkamp.

Countries also agreed to establish a process to address “loss and damage” resulting from climate change. Haverkamp says it indicates the UN’s recognition that the severe consequences of climate change have become today’s problem, no longer one of the distant future.

“This is the next step in the UN’s increasingly reactive response to climate change. First the focus was on avoiding emissions. When mitigation efforts proved inadequate, it turned more attention to adaptation. Now, as the effects of extreme weather and rising oceans hit communities from the Philippines to New Jersey, the UN has realized it must begin to grapple with the damaging effects of climate change it had been mostly trying to avoid,” said Haverkamp.

Doha’s outcome also reinforces the importance of continuing to make climate progress at the domestic and local levels. During the Doha talks, the Dominican Republic announced its commitments to reduce its carbon emissions 25% by 2030 from 2010 levels, and Belarus announced a domestic carbon market that will start in 2014.

“While more and deeper cuts are needed around the world, we’re seeing real action via national and state-wide climate programs in Europe, Australia, California, South Korea, China and others. It is domestic efforts like these, in tandem with multilateral accords and initiatives, that will get us to a secure climate future,” said Haverkamp.

Posted in Uncategorized | Tagged , , , , , , , , | Comments closed

Ice Mass Loss Mounting

from NASA

Ice Mass Loss in Greenland

Ice Mass Loss in Greenland

PASADENA, Calif. – An international team of experts supported by NASA and the European Space Agency (ESA) has combined data from multiple satellites and aircraft to produce the most comprehensive and accurate assessment to date of ice sheet losses in Greenland and Antarctica and their contributions to sea level rise.

In a landmark study published Thursday in the journal Science, 47 researchers from 26 laboratories report the combined rate of melting for the ice sheets covering Greenland and Antarctica has increased during the last 20 years. Together, these ice sheets are losing more than three times as much ice each year (equivalent to sea level rise of 0.04 inches or 0.95 millimeters) as they were in the 1990s (equivalent to 0.01 inches or 0.27 millimeters). About two-thirds of the loss is coming from Greenland, with the rest from Antarctica.

This rate of ice sheet losses falls within the range reported in 2007 by the Intergovernmental Panel on Climate Change (IPCC). The spread of estimates in the 2007 IPCC report was so broad, however, it was not clear whether Antarctica was growing or shrinking. The new estimates, which are more than twice as accurate because of the inclusion of more satellite data, confirm both Antarctica and Greenland are losing ice. Combined, melting of these ice sheets contributed 0.44 inches (11.1 millimeters) to global sea levels since 1992. This accounts for one-fifth of all sea level rise over the 20-year survey period. The remainder is caused by the thermal expansion of the warming ocean, melting of mountain glaciers and small Arctic ice caps, and groundwater mining.

The study was produced by an international collaboration — the Ice Sheet Mass Balance Inter-comparison Exercise (IMBIE) — that combined observations from 10 satellite missions to develop the first consistent measurement of polar ice sheet changes. The researchers reconciled differences among dozens of earlier ice sheet studies by carefully matching observation periods and survey areas. They also combined measurements collected by different types of satellite sensors, such as ESA’s radar missions; NASA’s Ice, Cloud and land Elevation Satellite (ICESat); and the NASA/German Aerospace Center’s Gravity Recovery and Climate Experiment (GRACE).

“What is unique about this effort is that it brought together the key scientists and all of the different methods to estimate ice loss,” said Tom Wagner, NASA’s cryosphere program manager in Washington. “It’s a major challenge they undertook, involving cutting-edge, difficult research to produce the most rigorous and detailed estimates of ice loss from Greenland and Antarctica to date. The results of this study will be invaluable in informing the IPCC as it completes the writing of its Fifth Assessment Report over the next year.”

Professor Andrew Shepherd of the University of Leeds in the United Kingdom coordinated the study, along with research scientist Erik Ivins of NASA’s Jet Propulsion Laboratory in Pasadena, Calif. Shepherd said the venture’s success is because of the cooperation of the international scientific community and the precision of various satellite sensors from multiple space agencies.

“Without these efforts, we would not be in a position to tell people with confidence how Earth’s ice sheets have changed, and to end the uncertainty that has existed for many years,” Shepherd said.

The study found variations in the pace of ice sheet change in Antarctica and Greenland.

“Both ice sheets appear to be losing more ice now than 20 years ago, but the pace of ice loss from Greenland is extraordinary, with nearly a five-fold increase since the mid-1990s,” Ivins said. “In contrast, the overall loss of ice in Antarctica has remained fairly constant, with the data suggesting a 50-percent increase in Antarctic ice loss during the last decade.”

Posted in Uncategorized | Tagged , , , , , , , , , , , , | Comments closed

WMO: Climate Change is of Great Concern

The World Meteorological Organization is cautioning humanity against global warming:

Climate change and its impacts is of great concern to humanity and is one of the most serious problems facing sustainable development worldwide. Through the network of National Meteorological and Hydrological Services of its Members, WMO plays an important role in weather and climate observation and monitoring, understanding of climate processes, the development of clear, precise and user-targeted information and predictions and the provision of sector-specific climate services, including advice, tools and expertise, to meet the needs of adaptation strategies and decision-making.

Climate information for adaptation and development needs
Role of WMO and NMHSs in the implementation of the Nairobi Work Programme
The Nairobi Work Programme on impacts, vulnerability and adaptation to climate change
WMO’s role in global climate change issues
Posted in Uncategorized | Tagged , , , , , , , , , , | Comments closed

Climate Change And Global Warming

Greenpeace says:

Stop Global Warming

We are changing our planet in a fundamental way. Our world is hotter today than it has been in two thousand years.

By the end of the century, if current trends continue, the global temperature could climb so high that the climate and weather patterns that have given rise to human civilization would be radically different.

But it didn’t happen on its own. We’re driving climate change by burning fossil fuels like coal and oil. In fact, coal-fired power plants are the single largest U.S. source of global warming pollution.

America’s coal-burning power plants, in addition to causing global warming and climate change, are killing tens of thousands of Americans, poisoning our air and water, and making our children sick.

But a brighter future is possible. Over the next three years, Greenpeace will:

1. Join local communities to shut down dangerous, dirty coal plants all across the United States.

2. Advocate for strong laws to curb global warming and put America on a path to clean energy.

3. Expose climate deniers, like the Koch Brothers, and hold them publicly accountable for providing millions of dollars to lobby against climate and clean energy policies.

4. Kick-start an Energy Revolution by advocating for clean-energy solutions like solar and wind power.

Posted in Uncategorized | Tagged , , , , , , , , , | Comments closed

Extreme Ice Survey Team

The Extreme Ice Survey Team is composed of artists and scientists. The team is documenting the effects of global warming on the planet.

“To reveal the impact of climate change, James Baylod founded the Extreme Ice Survey (EIS), the most wide-ranging, ground-based, photographic study of glaciers ever conducted. National Geographic showcased this work in June 2007 and June 2010 issues. The project is also featured in the 2009 NOVA documentary “Extreme Ice,” and in the feature-length documentary, “Chasing Ice,” which premiered at the Sundance Film Festival in January 2012 (in theaters November 2012).”

“Balog, who in addition to being a photographer is a mountaineer with a graduate degree in geomorphology, recognized that extraordinary amounts of ice were vanishing with shocking speed.” The glaciers in the Rocky Mountains are expected to disappear within 20 years.

Ice Breaking Up Into Icebergs in Greenland

Ice Breaking Up Into Icebergs in Greenland

Rocky Mountains

Extreme Ice Survey http://extremeicesurvey.org/

More About Global Warning

Posted in Uncategorized | Tagged , , , , , , , , | Comments closed

Another Record Warm Month Leading to Record Warm Year

State of the Climate
National Oceanic and Atmospheric Administration
National Climatic Data Center

Summary Information

Global temperatures were fifth highest on record for Ocotber

Arctic sea ice doubles from last month, yet remains second lowest on record for October

The globally-averaged temperature for October 2012 was the fifth warmest October since record keeping began in 1880. October 2012 also marks the 36th consecutive October and 332nd consecutive month with a global temperature above the 20th century average.

Higher-than-average monthly temperatures were observed across much of Europe, western and far eastern Asia, northeastern and southwestern North America, central South America, northern Africa, and most of Australia. Meanwhile, much of northwestern and central North America, central Asia, parts of western and northern Europe, and southern Africa were notably below average.

Global temperature highlights: October

    • The combined average temperature over global land and ocean surfaces for October tied with 2008 as the fifth highest for October on record, at 58.23°F (14.63°C) or 1.13°F (0.63°C) above the 20th century average. The margin of error associated with this temperature is ±0.22°F (0.12°C).
October 2012 Blended Land and Sea Surface Temperature Anomalies
October 2012 Blended Land & Sea Surface Temperature Anomalies in °C
  • October marked the 36th consecutive October and 332nd consecutive month with a global temperature above the 20th century average. The last below-average October was October 1976 and the last below-average month was February 1985.
  • The global land temperature was the eighth warmest October on record, at 1.66°F (0.92°C) above the 20th century average of 48.7°F (9.3°C). The margin of error is ±0.13°F (0.07°C).
  • Higher-than-average monthly temperatures were most notable across Europe, western and far eastern Asia, northeastern and southwestern North America, central South America, northern Africa, and most of Australia, while temperatures were below average across much of northwestern and central North America, central Asia, parts of western and northern Europe, and southern Africa.
    • The average temperature across the United Kingdom was 2.3°F (1.3°C) below the 1981–2010 average, making it the coldest October since 2003.
    • Temperatures were above average across southeastern Europe during October. The Republic of Moldova reported monthly temperatures that ranged from 4.5 to 6.3°F (2.5 to 3.5°C) above average across the country.
    • Every state and territory in Australia observed above-average monthly maximum temperatures during October. The nationally-averaged temperature was 2.75°F (1.53°C) above the 1961–1990 average, making it the 10th warmest October maximum temperature since records began in 1950.
  • For the ocean, the October global sea surface temperature was 0.94°F (0.52°C) above the 20th century average of 60.6°F (15.9°C), tying with 2004 as the fourth highest on record for October. The margin of error is ±0.07°F (0.04°C). The northwestern Atlantic Ocean and part of the north central Pacific Ocean temperatures were markedly higher than average, while much of the eastern and part of the western Pacific Ocean and much of the southern Atlantic Ocean were below average.
  • Borderline neutral / weak El Niño conditions were present during October across the central and eastern equatorial Pacific Ocean, with sea surface temperatures close to 0.9°F (0.5°C) above average for a three-month period, the official threshold for the onset of El Niño conditions. According to NOAA’s Climate Prediction Center, neutral conditions are expected to continue through the Northern Hemisphere’s winter 2012/13.

Precipitation highlights: October

  • Sandy dumped copious rain over Jamaica, Haiti, the Dominican Republic, Cuba, and much of the eastern United States. Sandy also brought blizzard conditions to the Central and Southern Appalachians, shattering all-time U.S. October monthly and single storm snowfall records.
  • The Finnish Meteorological Institute reported that precipitation totals across western parts of the country were double the October monthly average. Some stations broke their all-time highest monthly precipitation records for October.
  • October was dry across Australia, with the country experiencing rainfall that was 48 percent of average for the month. This was the 10th driest October since precipitation records began in 1900.

Snow cover & polar ice highlights: October

    • The Northern Hemisphere snow cover extent for October was the eighth largest monthly extent in the 45-year period of record, at 734,000 square miles above average. The North American snow cover extent was the seventh largest on record for October, while the Eurasian snow cover was the 11th largest. Canada and Russia both experienced much above average October snow cover.
October 2012 Northern Hemisphere Sea Ice Extent
October 2012 Southern Hemisphere Sea Ice Extent
Arctic and Antarctic sea ice extent, from the October 2012 Global Snow & Ice Report
  • During the first full month of the annual growth cycle, Arctic sea ice doubled in size after reaching its record smallest minimum in September. The October Arctic sea ice extent was 2.7 million square miles, 24.6 percent below average. This marked the second smallest monthly sea ice extent on record—only slightly larger than the record small October extent of 2007.
  • On the opposite pole, Antarctic sea ice extent declined rapidly after reaching its largest annual maximum extent on record. October Antarctic sea ice extent was 7.3 million square miles, 3.4 percent above average, and the third largest October ice extent on record.

Global temperature highlights: Year to Date

    • Record to near-record warmth over land from April to September and above-average global ocean temperatures resulted in the first ten months of 2012 ranking as the eighth warmest such period on record, with a combined global land and ocean average surface temperature of 1.04°F (0.58°C) above the 20th century average of 57.4°F (14.1°C). The margin of error is ±0.16°F (0.09°C).
Year-to-Date Temperature Anomalies: Horserace
Year-to-date temperatures by month, with 2012 compared to the five warmest years on record
  • The January–October worldwide land surface temperature was 1.69°F (0.94°C) above the 20th century average, making this the sixth warmest such period on record. The margin of error is ±0.38°F (0.21°C).
  • The global ocean surface temperature for the year to date was 0.79°F (0.44°C) above average, tying with 1997 as the 10th warmest such period on record. The margin of error is ±0.07°F (0.04°C).

Overview

The State of the Climate Report is a collection of monthly summaries recapping climate-related occurrences on both a global and national scale. The report is comprised of the following sections:

  • Global
  • Global Analysis — a summary of global temperatures and precipitation, placing the data into a historical perspective
  • Upper Air — tropospheric and stratospheric temperatures, with data placed into historical perspective
  • Global Snow & Ice — a global view of snow and ice, placing the data into a historical perspective
  • Global Hazards — weather-related hazards and disasters around the world
  • El Niño/Southern Oscillation Analysis — atmospheric and oceanic conditions related to ENSO
  • National
  • National Overview — a summary of national and regional temperatures and precipitation, placing the data into a historical perspective
  • Drought — drought in the U.S.
  • Wildfires — a summary of wildland fires in the U.S. and related weather and climate conditions
  • Hurricanes & Tropical Storms — hurricanes and tropical storms that affect the U.S. and its territories
  • National Snow & Ice — snow and ice in the U.S.
  • Tornadoes — a summary of tornadic activity in the U.S.
  • Synoptic Discussion — a summary of synoptic activity in the U.S.
Posted in Uncategorized | Tagged , , , , , , , , | Comments closed

BP Admits to Crimes in Oil Spill

The multinational oil company, British Petroleum, has admitted to criminal activities related to the Gulf of Mexico oil spill.

PRESS RELEASE

BP confirms that it is in advanced discussions with the United States Department of Justice (DoJ) and the Securities & Exchange Commission (SEC) regarding proposed resolutions of all US federal government criminal and SEC claims against BP in connection with the Deepwater Horizon incident. No final agreements have yet been reached and any resolutions, if agreed, would be subject to federal court approvals in the United States.

The proposed resolutions are not expected to cover federal civil claims, including Clean Water Act claims, federal and state Natural Resource Damages claims; private civil claims in MDL 2179 that were not covered by the PSC settlement, private securities claims pending in MDL 2185 or state economic loss claims.

A further announcement will be made if and when final agreements are reached. Until final agreements are reached, there can be no certainty any such resolutions will be entered into.

RESOURCES

Posted in Uncategorized | Tagged , , , , , , | Comments closed
  • RSS Global Warming

    • 2012 Texas Air Quality: A Year In Review
      By Elena Craft, PhDAs we come to the end of another year, we reflect on all that has happened in the world of Texas air quality. This year has brought new challenges and reminded us of how much remains to be done in the quest for healthier air across the state. Our work is critical to the millions of those who are especially vulnerable to the harms of air po […]
    • Doha wrap-up: countries eke out modest deal on Kyoto, new agreement, and climate loss, but postpone many issues
      By Jennifer HaverkampIn Doha, countries wrapped up loose ends on technical issues and began to lay the groundwork for an eventual agreement that will establish commitments starting in 2020. Photo credit: Flickr user UNclimatechange It’s now been a couple of weeks since the UN climate talks ended in Doha, Qatar, where countries made modest progress on the roa […]
    • TERA’s Kids+Chemical Safety website: On non-profits, objectivity and independence
      By Richard DenisonRichard Denison, Ph.D., is a Senior Scientist. My recent post about the new American Chemistry Council (ACC)-sponsored website, Kids + Chemical Safety, engendered some comments that go directly to the issues of scientific objectivity and independence. The website says “TERA [Toxicology Excellence in Risk Assessment, manager of the site] was […]
  • RSS State Of The Climate

    • November 2012 Tornadoes
      According to data from NOAA's Storm Prediction Center, during November, there were 8 preliminary tornado reports. This is significantly less than the 1991-2010 average of 58 for the month. Tornado activity during November varies greatly from year to year, with the Gulf Coast states typically receiving the most November tornado occurrences. During Novemb […]
    • November 2012 Global Analysis
      The average combined global land and ocean surface temperature for November 2012 was 0.67°C (1.21°F) above the 20th century average of 12.9°C (60.4°F). This is the fifth warmest November since records began in 1880. Including this November, the 10 warmest Novembers have occurred in the past 12 years. The globally-averaged land surface temperature for Novembe […]
    • November 2012 Drought
      November 2012 marked a return to the warmth and dryness which characterized much of the year, ranking as the 20th warmest and eighth driest November (based on data back to 1895) when weather conditions are averaged across the country. Like the last several months, cool fronts swept across the country (weeks 1, 2, 3, 4), bringing below-normal monthly temperat […]
  • Archives

  • Archives