Human Induced Climate Change Experiment

Home | Resources | Archives |Contact Us


Fish Extinction

CBS news reports that a new study by Boris Worm, PhD, of Dalhousie University in Halifax, Nova Scotia predicts the extinction of all salt water fish by 2048. This extinction will be due to due to overfishing, pollution, habitat loss, and climate change.

“I was shocked and disturbed by how consistent these trends are — beyond anything we suspected,” Worm says in a news release.

“This isn’t predicted to happen. This is happening now,” study researcher Nicola Beaumont, PhD, of the Plymouth Marine Laboratory, U.K., says in a news release.

“If biodiversity continues to decline, the marine environment will not be able to sustain our way of life. Indeed, it may not be able to sustain our lives at all,” Beaumont adds.

Already, 29% of edible fish and seafood species have declined by 90% — a drop that means the collapse of these fisheries.

But the issue isn’t just having seafood on our plates. Ocean species filter toxins from the water. They protect shorelines. And they reduce the risks of algae blooms such as the red tide.

“A large and increasing proportion of our population lives close to the coast; thus the loss of services such as flood control and waste detoxification can have disastrous consequences,” Worm and colleagues say.

The researchers analyzed data from 32 experiments on different marine environments.

They then analyzed the 1,000-year history of 12 coastal regions around the world, including San Francisco and Chesapeake bays in the U.S., and the Adriatic, Baltic, and North seas in Europe.

Next, they analyzed fishery data from 64 large marine ecosystems.

And finally, they looked at the recovery of 48 protected ocean areas.

Their bottom line: Everything that lives in the ocean is important. The diversity of ocean life is the key to its survival. The areas of the ocean with the most different kinds of life are the healthiest.

But the loss of species isn’t gradual. It’s happening fast — and getting faster, the researchers say.

Worm and colleagues call for sustainable fisheries management, pollution control, habitat maintenance, and the creation of more ocean reserves.

This, they say, isn’t a cost; it’s an investment that will pay off in lower insurance costs, a sustainable fish industry, fewer natural disasters, human health, and more.

“It’s not too late. We can turn this around,” Worm says. “But less than 1% of the global ocean is effectively protected right now.”

Posted in Uncategorized | Tagged , , , , , , , , | Comments closed

Effects of Climate Change Irreversible

The UN’s Intergovernmental Panel on Climate Change concludes that humans must reduce their carbon emissions to zero. The statement that carbon emissions must fall to zero was “game-changing”, according to Kaisa Kosonen of Greenpeace. “We can still limit warming to 2C, or even 1.5C or less even. We need to phase out emissions.”

The Guardian reports, “The stark report states that climate change has already increased the risk of severe heatwaves and other extreme weather and warns of worse to come, including food shortages and violent conflicts. But it also found that ways to avoid dangerous global warming are both available and affordable.”

“We have the means to limit climate change,” said Rajendra Pachauri, chair of the UN’s Intergovernmental Panel on Climate Change (IPCC). “The solutions are many and allow for continued economic and human development. All we need is the will to change.”

Lord Nicholas Stern, a professor at the London School of Economics, said the new IPCC report was the “most important assessment of climate change ever prepared” and that it made plain that “further delays in tackling climate change would be dangerous and profoundly irrational”.

“The reality of climate change is undeniable, and cannot be simply wished away by politicians who lack the courage to confront the scientific evidence,” he said, adding that the lives and livelihoods of hundreds of millions of people were at risk.

The IPCC’s press release:
IPCC Climate Change

Posted in Uncategorized | Tagged , , , | Comments closed

Ebola Outbreak

The 2014 Ebola epidemic is the largest in history, affecting multiple countries in West Africa. Although the risk of an Ebola outbreak in the United States is very low, CDC and partners are taking precautions to prevent this from happening. On 9/30/2014, CDC confirmed, the first travel-associated case of Ebola to be diagnosed in the United States.

Overview

The 2014 Ebola epidemic is the largest in history, affecting multiple countries in West Africa. There were a small number of cases reported in Nigeria and a single case reported in Senegal; however, these cases are considered to be contained, with no further spread in these countries.

On September 30, 2014, CDC confirmed, the first travel-associated case of Ebola to be diagnosed in the United States. CDC and partners are taking precautions to prevent the spread of Ebola within the United States. CDC is working with other U.S. government agencies, the World Health Organization (WHO), and other domestic and international partners and has activated its Emergency Operations Center to help coordinate technical assistance and control activities with partners. CDC has also deployed teams of public health experts to West Africa and will continue to send experts to the affected countries.

As of October 5, 2014
(Updated October 8, 2014)
Total Cases: 8033
Laboratory-Confirmed Cases: 4461
Total Deaths: 3865

Posted in Uncategorized | Tagged , , , | Comments closed

Record Level Greenhouse Gases

The World Meteorological Organization (WMO) published a new report that “Record Greenhouse Gas Levels Impact Atmosphere and Oceans” and “Carbon Dioxide Concentration Surges“:

Geneva, 9 September 2014 (WMO) – The amount of greenhouse gases in the atmosphere reached a new record high in 2013, propelled by a surge in levels of carbon dioxide. This is according to the World Meteorological Organization’s annual Greenhouse Gas Bulletin, which injected even greater urgency into the need for concerted international action against accelerating and potentially devastating climate change.

The Greenhouse Gas Bulletin showed that between 1990 and 2013 there was a 34% increase in radiative forcing – the warming effect on our climate – because of long-lived greenhouse gases such as carbon dioxide (CO2), methane and nitrous oxide.

In 2013, concentration of CO2 in the atmosphere was 142% of the pre-industrial era (1750), and of methane and nitrous oxide 253% and 121% respectively.

The observations from WMO’s Global Atmosphere Watch (GAW) network showed that CO2 levels increased more between 2012 and 2013 than during any other year since 1984. Preliminary data indicated that this was possibly related to reduced CO2 uptake by the earth’s biosphere in addition to the steadily increasing CO2 emissions.

The WMO Greenhouse Gas Bulletin reports on atmospheric concentrations – and not emissions – of greenhouse gases. Emissions represent what goes into the atmosphere. Concentrations represent what remains in the atmosphere after the complex system of interactions between the atmosphere, biosphere and the oceans. About a quarter of the total emissions are taken up by the oceans and another quarter by the biosphere, reducing in this way the amount of CO2 in the atmosphere.

The ocean cushions the increase in CO2 that would otherwise occur in the atmosphere, but with far-reaching impacts. The current rate of ocean acidification appears unprecedented at least over the last 300 million years, according to an analysis in the report.

“We know without any doubt that our climate is changing and our weather is becoming more extreme due to human activities such as the burning of fossil fuels,” said WMO Secretary-General Michel Jarraud.

“The Greenhouse Gas Bulletin shows that, far from falling, the concentration of carbon dioxide in the atmosphere actually increased last year at the fastest rate for nearly 30 years. We must reverse this trend by cutting emissions of CO2 and other greenhouse gases across the board,” he said. “We are running out of time.”

“Carbon dioxide remains in the atmosphere for many hundreds of years and in the ocean for even longer. Past, present and future CO2 emissions will have a cumulative impact on both global warming and ocean acidification. The laws of physics are non-negotiable,” said Mr Jarraud.

“The Greenhouse Gas Bulletin provides a scientific base for decision-making. We have the knowledge and we have the tools for action to try keep temperature increases within 2°C to give our planet a chance and to give our children and grandchildren a future. Pleading ignorance can no longer be an excuse for not acting,” said Mr Jarraud.

“The inclusion of a section on ocean acidification in this issue of WMO’s Greenhouse Gas Bulletin is appropriate and needed. It is high time the ocean, as the primary driver of the planet’s climate and attenuator of climate change, becomesa central part of climate change discussions,” said Wendy Watson-Wright, Executive Secretary of the Intergovernmental Oceanographic Commission of UNESCO.

“If global warming is not a strong enough reason to cut CO2 emissions, ocean acidification should be, since its effects are already being felt and will increase for many decades to come. I echo WMO Secretary General Jarraud’s concern – we ARE running out of time,” she said.

Atmospheric Concentrations

Carbon dioxide accounted for 80% of the 34% increase in radiative forcing by long-lived greenhouse gases from 1990 to 2013, according to the U.S. National Oceanic and Atmospheric Administration (NOAA) Annual Greenhouse Gas Index.

On the global scale, the amount of CO2 in the atmosphere reached 396.0 parts per million in 2013. The atmospheric increase of CO2 from 2012 to 2013 was 2.9 parts per million, which is the largest annual increase for the period 1984-2013. Concentrations of CO2 are subject to seasonal and regional fluctuations. At the current rate of increase, the global annual average CO2 concentration is set to cross the symbolic 400 parts per million threshold in 2015 or 2016.

Methane is the second most important long-lived greenhouse gas. Approximately 40% of methane is emitted into the atmosphere by natural sources (e.g., wetlands and termites), and about 60 % comes from human activities like cattle breeding, rice agriculture, fossil fuel exploitation, landfills and biomass burning. Atmospheric methane reached a new high of about 1824 parts per billion (ppb) in 2013, due to increased emissions from anthropogenic sources. Since 2007, atmospheric methane has been increasing again after a temporary period of leveling-off.

Nitrous oxide (N2O)

Nitrous oxide is emitted into the atmosphere from both natural (about 60%) and anthropogenic sources (approximately 40%), including oceans, soil, biomass burning, fertilizer use, and various industrial processes. Its atmospheric concentration in 2013 was about 325.9 parts per billion. Its impact on climate, over a 100-year period, is 298 times greater than equal emissions of carbon dioxide. It also plays an important role in the destruction of the stratospheric ozone layer which protects us from the harmful ultraviolet rays of the sun.

Ocean Acidification:

For the first time, this Bulletin contains a section on ocean acidification prepared in collaboration with the International Ocean Carbon Coordination Project (IOCCP) of the Intergovernmental Oceanographic Commission of UNESCO (IOC-UNESCO), the Scientific Committee on Oceanic Research (SCOR), and the Ocean Acidification International Coordination Centre (OA-ICC) of the International Atomic Energy Agency (IAEA).

The ocean currently absorbs one-fourth of anthropogenic CO2 emissions, reducing the increase in atmospheric CO2 that would otherwise occur because of fossil fuel combustion. Enhanced ocean CO2 uptake alters the marine carbonate system and lead to increasing acidity. The ocean’s acidity increase is already measurable as oceans take up about 4 kilogrammes of CO2 per day per person.

The current rate of ocean acidification appears unprecedented at least over the last 300 million years, based on proxy-data from paleo archives. In the future, acidification will continue to accelerate at least until mid-century, based on projections from Earth system models.

The potential consequences of ocean acidification on marine organisms are complex. A major concern is the response of calcifying organisms, such as corals, algae, mollusks and some plankton, because their ability to build shell or skeletal material (via calcification) depends on the abundance of carbonate ion. For many organisms, calcification declines with increased acidification. Other impacts of acidification include reduced survival, development, and growth rates as well as changes in physiological functions and reduced biodiversity.

Posted in Uncategorized | Tagged , , , , , , , | Comments closed

Global Warming Already Dangerous

The United Nations’ Intergovernmental Panel on Climate Change sent governments a final draft of an international report on global warming.

The 127-page draft, obtained by The Associated Press, paints a harsh warning of what’s causing global warming and what it will do to humans and the environment. It also describes what can be done about it.

“Continued emission of greenhouse gases will cause further warming and long-lasting changes in all components of the climate system, increasing the likelihood of severe, pervasive and irreversible impacts for people and ecosystems,” the report says. The final report will be issued after governments and scientists go over the draft line by line in an October conference in Copenhagen.

Depending on circumstances and values, “currently observed impacts might already be considered dangerous,” the report says. It mentions extreme weather and rising sea levels, such as heat waves, flooding and droughts. It even raises, as an earlier report did, the idea that climate change will worsen violent conflicts and refugee problems and could hinder efforts to grow more food. And ocean acidification, which comes from the added carbon absorbed by oceans, will harm marine life, it says.

Without changes in greenhouse gas emissions, “climate change risks are likely to be high or very high by the end of the 21st century,” the report says.

In 2009, countries across the globe set a goal of limiting global warming to about another 2 degrees Fahrenheit above current levels. But the report says that it is looking more likely that the world will shoot past that point. Limiting warming to that much is possible but would require dramatic and immediate cuts in carbon dioxide pollution.

Posted in Uncategorized | Tagged , , , , | Comments closed

June 2014 Hottest Month Ever

NOAA reports:


Global Highlights

  • The combined average temperature over global land and ocean surfaces for June 2014 was the highest on record for the month, at 0.72°C (1.30°F) above the 20th century average of 15.5°C (59.9°F).
  • The global land surface temperature was 0.95°C (1.71°F) above the 20th century average of 13.3°C (55.9°F), the seventh highest for June on record.
  • For the ocean, the June global sea surface temperature was 0.64°C (1.15°F) above the 20th century average of 16.4°C (61.5°F), the highest for June on record and the highest departure from average for any month.
  • The combined global land and ocean average surface temperature for the January–June period (year-to-date) was 0.67°C (1.21°F) above the 20th century average of 13.5°C (56.3°F), tying with 2002 as the third warmest such period on record.

Supplemental Information

Introduction

Temperature anomalies and percentiles are shown on the gridded maps below. The anomaly map on the left is a product of a merged land surface temperature (Global Historical Climatology Network, GHCN) and sea surface temperature (ERSST.v3b) anomaly analysis developed by Smith et al. (2008). Temperature anomalies for land and ocean are analyzed separately and then merged to form the global analysis. For more information, please visit NCDC’s Global Surface Temperature Anomalies page. The percentile maps on the right provide additional information by placing the temperature anomaly observed for a specific place and time period into historical perspective, showing how the most current month, season or year compares with the past.

The most current data may be accessed via the Global Surface Temperature Anomalies page.

[ top ]

Temperatures

In the atmosphere, 500-millibar height pressure anomalies correlate well with temperatures at the Earth’s surface. The average position of the upper-level ridges of high pressure and troughs of low pressure—depicted by positive and negative 500-millibar height anomalies on the June 2014 map—is generally reflected by areas of positive and negative temperature anomalies at the surface, respectively.

June

The combined average temperature across global land and ocean surfaces for June 2014 was record high for the month, at 0.72°C (1.30°F) above the 20th century average. This surpasses the previous record, set in June 1998, by 0.03°C (0.05°F). Nine of the ten warmest Junes on record have occurred during the 21st century, including each of the past five years. June 2014 also marks the second consecutive month with record high global temperatures. With the exception of February (21st warmest), every month to date in 2014 has ranked among the four warmest for its respective month. Additionally, June 2014 marked the 38th consecutive June and 352nd consecutive month with a global temperature above the 20th century average. The last below-average global temperature for June was June 1976 and the last below-average global temperature for any month was February 1985.

The June global land temperature was the seventh highest for June on record at 0.95°C (1.71°F) above the 20th century average of 13.3°C (55.9°F). The seven warmest June global land surface temperatures have all occurred within the past decade. The warmth was fairly evenly distributed between the Northern and Southern Hemispheres, with the Northern Hemisphere land-surface temperature sixth highest on record and the Southern Hemisphere land-surface temperature fifth highest. As indicated by the Land & Ocean Percentiles Map above, record warmth was present across part of southern Greenland, parts of northern South America, areas in eastern and central Africa, and sections of southern and southeastern Asia. A few areas in North America, Far East Russia, and small parts of central and eastern Europe were cooler or much cooler than average.

Select national information is highlighted below. (Please note that different countries report anomalies with respect to different base periods. The information provided here is based directly upon these data):

  • New Zealand observed its warmest June since national records began in 1909. The warmth was notable for both its intensity and coverage, according to NIWA, with above-average temperatures from the northernmost of the North Island to the southernmost of the South Island.
  • The average monthly temperature for Australia during June 2014 was above average, with variations across the country. Most of the states were warmer than average, with Victoria and Tasmania observing their seventh and tenth warmest June, respectively. However, both Western Australia and the Northern Territory had below-average monthly temperatures, marking the first below-average statewide temperatures for any state since February.
  • The June temperature for the United Kingdom tied with 2010 as the ninth warmest June since records began in 1910, at 1.2°C (2.2°F) above the 1981–2010 average. In Scotland, the June minimum temperature was record high for the month.
  • June in Latvia was 0.9°C (1.6°F) cooler than average, marking the second coolest June of the 21st century, behind 2004.
  • Austria observed a June temperature that was 1.0°C (1.8°F) higher than the 1981–2010 average. The warmth was driven by a heat wave during June 7–13, when many regions broke daily maximum temperature records.
  • France observed its fifth warmest June in the country’s 115-year period of record, at 1.3°C (2.3°F) above the 1981–2010 average. The week-long heat wave that impacted Austria also extended to France from the 7th to the 14th, contributing to the overall warmth for the month.
  • Spain had a June temperature that was 1.3°C (2.3°F) higher than the 1971–2000 average. However, this June ranks as the fifth coolest (11th warmest) in the past 15 years, according to AEMet, Spain’s national meteorological agency.
  • Parts of Greenland were record warm during June. According to the Danish Meteorological Institute (DMI), Kangerlussuaq in southwestern Greenland recorded its record highest maximum June temperature of 23.2°C (73.8°F) on June 15, surpassing the previous record of 23.1°C (73.6°F) set in 1988 and tied in 2002. Records at this station date back to 1958.
  • It was also warmer-than-average in Iceland. Stykkishòlmur in western Iceland recorded its warmest June since local records began in 1845, while the capital of Reykjavìk had its fourth warmest June since records began there in 1871. Every station, as reported by the Icelandic Met Office, had a June temperature among their seven highest for their respective periods of records (the periods of record vary by station).

For the ocean, the June global sea surface temperature was record warm, at 0.64°C (1.15°F) above the 20th century average of 16.4°C (61.5°F). This marks the first time that the monthly global ocean temperature anomaly was higher than 0.60°C (1.08°F) and surpasses the previous all-time record for any month by 0.05°C (0.09°F); the previous record of +0.59°C (1.06°F) was first set in June 1998 and tied in October 2003, July 2009, and just last month in May 2014. Similar to May, scattered sections across every major ocean basin were record warm. Notably, large parts of the western equatorial and northeastern Pacific Ocean and nearly all of the Indian Ocean were record warm or much warmer than average for the month. Although neither El Niño nor La Niña conditions were present across the central and eastern equatorial Pacific Ocean during June 2014, the ocean waters in that region continued to trend above average. NOAA’s Climate Prediction Center estimates that there is about a 70 percent chance that El Niño conditions will develop during Northern Hemisphere summer 2014 and 80 percent chance it will develop during the fall and winter.

June Anomaly Rank
(out of 135 years)
Records
°C °F Year(s) °C °F
Global
Land +0.95 ± 0.14 +1.71 ± 0.25 Warmest 7th 2012 +1.17 +2.11
Coolest 129th 1907 -0.63 -1.13
Ocean +0.64 ± 0.04 +1.15 ± 0.07 Warmest 1st 2014 +0.64 +1.15
Coolest 135th 1909, 1911 -0.50 -0.90
Land and Ocean +0.72 ± 0.09 +1.30 ± 0.16 Warmest 1st 2014 +0.72 +1.30
Coolest 135th 1911 -0.46 -0.83
Northern Hemisphere
Land +0.98 ± 0.13 +1.76 ± 0.23 Warmest 6th 2012 +1.39 +2.50
Coolest 130th 1907 -0.71 -1.28
Ocean +0.71 ± 0.05 +1.28 ± 0.09 Warmest 1st 2014 +0.71 +1.28
Coolest 135th 1910 -0.53 -0.95
Land and Ocean +0.81 ± 0.12 +1.46 ± 0.22 Warmest 1st 2010, 2012, 2014 +0.81 +1.46
Coolest 135th 1913 -0.51 -0.92
Ties: 2010, 2012
Southern Hemisphere
Land +0.88 ± 0.13 +1.58 ± 0.23 Warmest 5th 2005 +1.16 +2.09
Coolest 131st 1911 -0.93 -1.67
Ocean +0.58 ± 0.04 +1.04 ± 0.07 Warmest 2nd 1998 +0.61 +1.10
Coolest 134th 1911 -0.55 -0.99
Land and Ocean +0.63 ± 0.06 +1.13 ± 0.11 Warmest 2nd 1998 +0.64 +1.15
Coolest 134th 1911 -0.61 -1.10

The most current data may be accessed via the Global Surface Temperature Anomalies page.

[ top ]

Year-to-date (January–June)

The first half of 2014 (January–June) tied with 2002 as the third warmest such period on record across the world’s land and ocean surfaces, at 0.67°C (1.21°F) above the 20th century average. The average global sea surface temperature was the third highest for January–June in the 135-year period of record, behind 1998 (highest) and 2010 (second highest), while the average land surface temperature tied with 1998 and 2005 as the fourth highest. Record warmth was observed over areas that included part of the western United States, a large swath of eastern Australia, much of the northeastern and western equatorial Pacific, sections of the eastern North Atlantic and eastern South Atlantic, and parts of the Greenland, Norwegian, and Barents Seas. Parts of eastern North America and the Southern Ocean off the tip of South America were much cooler than average, with a small region of each observing record cold for the six-month period.

Select national information is highlighted below. (Please note that different countries report anomalies with respect to different base periods. The information provided here is based directly upon these data):

  • The first six months of 2014 was the second warmest such period for France since records began in 1900, behind only 2007, with a departure of 1.4°C (2.5°C) from the 1981–2010 average. With the exception of May (-0.3°C / -0.6°F), every month in 2014 to date had above-average temperatures.
January–June Anomaly Rank
(out of 135 years)
Records
°C °F Year(s) °C °F
Global
Land +1.04 ± 0.23 +1.87 ± 0.41 Warmest 4th 2007 +1.25 +2.25
Coolest 132nd 1893 -0.82 -1.48
Ties: 1998, 2005
Ocean +0.53 ± 0.05 +0.95 ± 0.09 Warmest 3rd 1998 +0.57 +1.03
Coolest 133rd 1911 -0.51 -0.92
Land and Ocean +0.67 ± 0.10 +1.21 ± 0.18 Warmest 3rd 2010 +0.72 +1.30
Coolest 133rd 1911 -0.52 -0.94
Ties: 2002
Northern Hemisphere
Land +1.10 ± 0.28 +1.98 ± 0.50 Warmest 5th 2007 +1.41 +2.54
Coolest 131st 1893 -0.95 -1.71
Ocean +0.55 ± 0.07 +0.99 ± 0.13 Warmest 2nd 2010 +0.56 +1.01
Coolest 134th 1910 -0.48 -0.86
Land and Ocean +0.76 ± 0.15 +1.37 ± 0.27 Warmest 4th 2007 +0.82 +1.48
Coolest 132nd 1893 -0.59 -1.06
Southern Hemisphere
Land +0.90 ± 0.16 +1.62 ± 0.29 Warmest 5th 2005 +1.03 +1.85
Coolest 131st 1917 -0.88 -1.58
Ocean +0.52 ± 0.05 +0.94 ± 0.09 Warmest 5th 1998 +0.61 +1.10
Coolest 131st 1911 -0.53 -0.95
Land and Ocean +0.58 ± 0.07 +1.04 ± 0.13 Warmest 4th 1998 +0.66 +1.19
Coolest 132nd 1911 -0.55 -0.99

The most current data may be accessed via the Global Surface Temperature Anomalies page.

[ top ]

Precipitation

June

The maps below represent precipitation percent of normal (left) and precipitation percentiles (right) based on the GHCN dataset of land surface stations using a base period of 1961–1990. As is typical, precipitation anomalies during June 2014 varied significantly around the world, with many areas seeing either much below-average or much above-average precipitation. Extreme wetness was observed during June over regions that included central North America and parts of eastern and northern Europe. Extreme dryness was scattered across different parts of the globe, including much of South Asia and Australia.

Some national precipitation information is highlighted below

  • Australia received 68 percent of average rainfall during June. Western Australia received just 28 percent of its average rainfall for the month, the seventh lowest for June for the state.
  • The onset of the Southwest Asian Monsoon officially occurs when the monsoon crosses Kerala in southern India, according to the India Meteorological Department (IMD). The monsoon typically reaches Kerala around June 1. This year the onset was nearly a week late, arriving on June 6. Through the month of June, the cumulative rainfall was just 57 percent of average for the country as a whole. Every region experienced rainfall deficits during this period, ranging from 39 percent of average in Central India to 74 percent of average in East and Northeast India. The monsoon season lasts from early June through late September.
Posted in Uncategorized | Tagged , , | Comments closed

Climate Change Killing Antarctica’s Emperor Penguins

Live Science reports:

 
Emperor penguins depend on the sea ice that rings the continent of Antarctic, so it’s no surprise that global warming, which is expected to melt some of that ice, may be bad news for these flightless, 4-foot (1.2-meter) tall birds.

Since detailed information on most colonies is not available, the research focused on one well-studied colony of emperor penguins, at Terre Adélie in East Antarctica, to get an idea of what might happen to emperor penguins over the course of this century.

Their results aren’t reassuring; they project this colony is likely to decline from 3,000 breeding pairs to 575 by 2100, a potentially “huge decline,” said lead researcher Stéphanie Jenouvrier, a biologist at the Woods Hole Oceanographic Institution.

Posted in Uncategorized | Tagged , , , | Comments closed

Hidden Greenland Canyons = Sea Level Rise

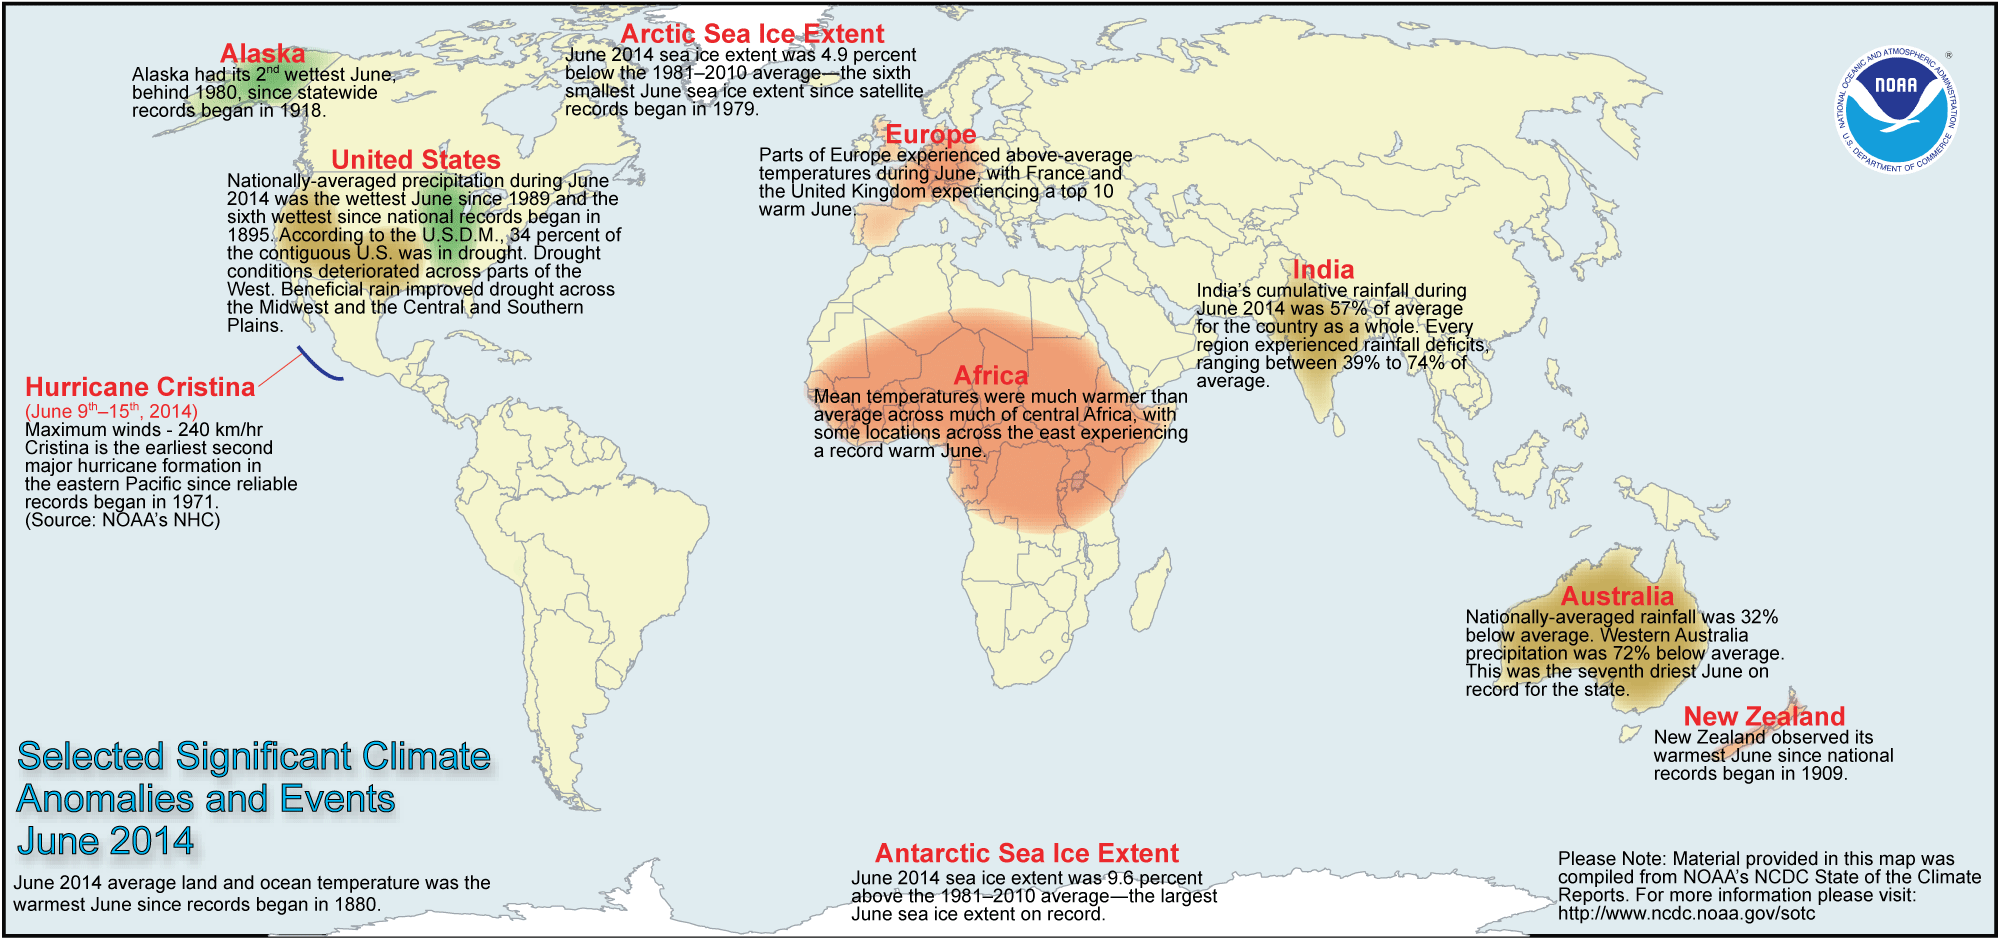
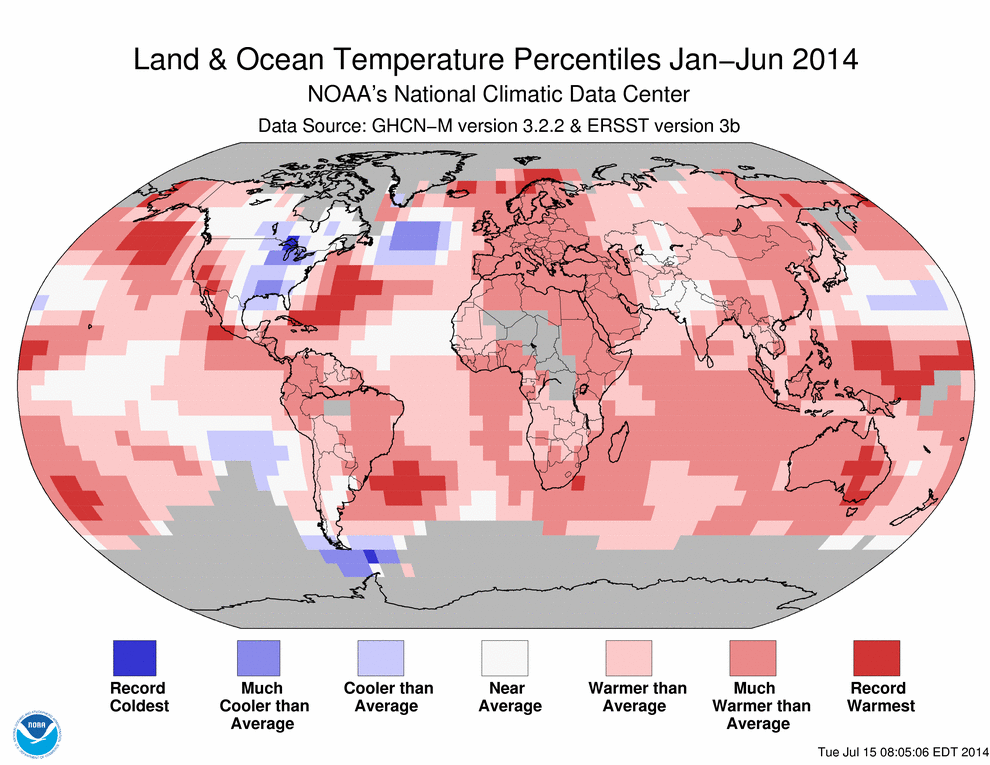
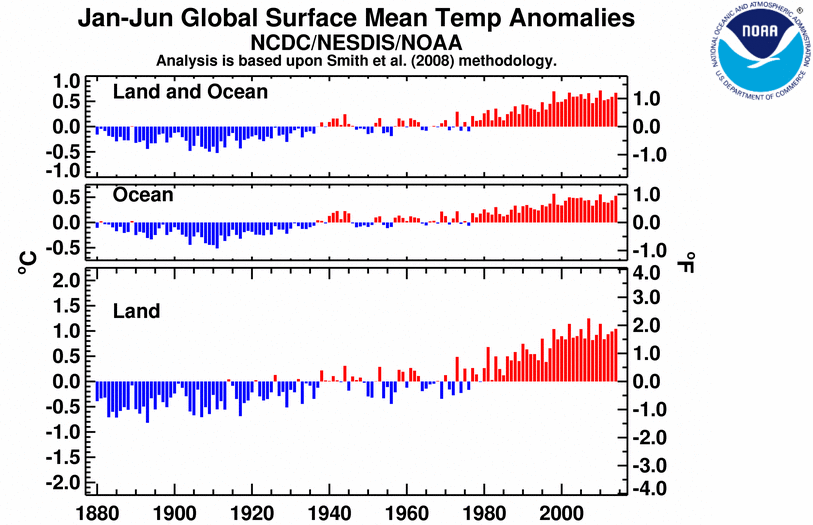
NASA reports: New maps of the bedrock beneath Greenland’s ice sheet (right) have found long, deep canyons that are likely to cause ocean-feeding glaciers (left) to retreat faster and farther inland than previously thought. Credit: NASA

Scientists at NASA and the University of California, Irvine (UCI), have found that canyons under Greenland’s ocean-feeding glaciers are deeper and longer than previously thought, increasing the amount of Greenland’s estimated contribution to future sea level rise.

“The glaciers of Greenland are likely to retreat faster and farther inland than anticipated, and for much longer, according to this very different topography we have discovered,” said Mathieu Morlighem, a UCI associate project scientist who is lead author of the new research paper. The results were published Sunday in the journal Nature Geoscience.

Ice loss from Greenland has accelerated during the last few decades. However, older ice sheet models predicted the speedup would be temporary because the glaciers would soon melt back onto higher ground and stabilize. The models therefore projected Greenland’s contribution to global sea level rise would be limited.

Morlighem’s new topography shows southern Greenland’s ragged, crumbling coastline is scored by more than 100 canyons beneath glaciers that empty into the ocean. Many canyons are well below sea level as far as 60 miles (100 kilometers) inland. Higher ground, where glaciers could stabilize, is much farther from the coastline than previously thought. The finding calls into question the idea that the recent accelerated ice loss will be short-lived.

Buried under the Greenland Ice Sheet, the subcontinent’s bedrock topography has been estimated using soundings from ice-penetrating radar. However, the wet and fractured ice along the southern coastline cluttered the radar soundings so that large swaths of the bed remained invisible. To overcome that problem, Morlighem and his colleagues devised an advanced technique to create a more accurate map. The technique makes the best use of several kinds of data: ice thickness measurements derived from airborne radar; satellite radar interferometry data on the speed and direction of ice movement: and estimates of snowfall and surface melt to the sea. By combining the different types of data, they were able to map the bed topography along Greenland’s margins with unprecedented precision and detail.

“We have been able to make a quantum leap in our knowledge of bed topography beneath ice sheets in the last decade, thanks to the advent of missions like NASA’s Operation IceBridge in combination with satellite data on the speed these ice sheets are flowing,” said co-author Eric Rignot of UCI and NASA’s Jet Propulsion Laboratory, Pasadena, California.

The same research team reported new findings on glacial melt in West Antarctica last week.

“Together the papers illustrate clearly the globe’s ice sheets will contribute far more to sea level rise than current projections show,” said Rignot.

The study used synthetic aperture radar data collected in 2008-2009 by the Japanese Advanced Land Observing System Phased Array type L-band Synthetic Aperture Radar (ALOS PALSAR), the Canadian RADARSAT-1, the German TerraSAR-X, and the European Envisat Advanced Synthetic Aperture Radar (ASAR). Ice thinning rates were derived from NASA’s Airborne Topographic Mapper and ICESat data, and ice thickness data came from NASA’s Operation IceBridge airborne campaigns.

Posted in Uncategorized | Tagged , , , , , | Comments closed

Understand Climate Change

The USA has released a report on climate disruption.
Climate change is happening now. The U.S. and the world are warming, global sea level is rising, and some types of extreme weather events are becoming more frequent and more severe. These changes have already resulted in a wide range of impacts across every region of the Nation and many sectors of the economy. Today, America needs reliable scientific information about current and future changes, impacts, and effective response options. The U.S. Global Change Research Program—which released the Third National Climate Assessment in May 2014—is at the center of fulfilling this critical need.

Evidence from the top of the atmosphere to the depths of the oceans, collected by scientists and engineers from around the world, tells an unambiguous story: the planet is warming, and over the last half century, this warming has been driven primarily by human activity—predominantly the burning of fossil fuels.

Climate change is affecting the American people in far-reaching ways. Impacts related to climate change are evident across regions and in many sectors important to society—such as human health, agriculture and food security, water supply, transportation, energy, ecosystems, and others—and are expected to become increasingly disruptive throughout this century and beyond.

As the world has warmed, that warming has triggered many other changes to the Earth’s climate. Changes in extreme weather and climate events, such as heat waves and droughts, are the primary way that most people experience climate change. Human-induced climate change has already increased the number and strength of some of these extreme events. Over the last 50 years, much of the U.S. has seen increases in prolonged periods of excessively high temperatures, heavy downpours, and in some regions, severe floods and droughts.

Posted in Uncategorized | Tagged , , , , , , , , , , | Comments closed

Desmond Tutu Global Forgiveness Challenge

Peter Gabriel asks you take Desmond Tutu’s challenge. We all have something to forgive or to be forgiven for. Let us guide you on a journey of forgiveness and healing. Together we can heal the world!

Video Created by Sparkbug Creative
Produced by Idea Architects
Narration by Desmond Tutu
Motion Graphics by Matt Goodwin
Sound Design by Andrew Mumm
Original Score by Daniel Berk

Posted in Uncategorized | Tagged , , , | Comments closed
  • RSS Membrane Domain

    • Greenhouse Gas Levels at Highest Point in 800,000 Years
      The Membrane Domain has been conducting research on climate change since 1999. Don’t you hate it when this happens? The ABC, Australia’s public broadcaster, is reporting: The world’s top scientists have given their clearest warning yet of the severe and irreversible impacts of climate change. The United Nations Intergovernmental Panel on Climate Change (IPCC […]
    • Turning Water Into Electricity
      It is possible to turn water into electricity. Solar energy is one of the cleanest and cheapest ways to convert liquid H2O into steam. The energy in steam is 9 times greater than the energy in the same weight of boiling water. The math suggests that each gallon of evaporated water is equal to running […]
    • The Costs of Solar Energy
      A lot of the environmental costs of solar depend on how the panels and batteries are produced, transported and disposed of… and most importantly how the energy is stored. As renewable energy grows, storage will become a greater problem. In general, we would be better off producing energy like the sun (fusion) than trying to […]
  • RSS Global Warming

    • In New Year, Cleaner Fuel Offshore Means Cleaner Air Onshore
      By Marcelo NorsworthySource: flickr/kestrana Hilary Sinnamon, clean air and transportation consultant, contributed to this post.  A key component of one of the most significant health protection measures adopted in the past several years will take effect in the New Year – and Texas is positioned to reap significant benefits. Large ocean-going ships, like con […]
    • Latest Mississippi River Delta news: Dec. 30, 2014
      Lafourche Parish project part of new emphasis on private financing in coastal work By Amy Wold, The Advocate (Baton Rouge). Dec. 30, 2014. "Organizers of a new coastal restoration project hope to show how these kind of projects can be done swiftly and somewhat cheaply through private investment, rather than solely depending on government to lead the way […]
    • Germany’s Energiewende Requires Sophisticated Governance, Political Stamina
      By Peter SopherConceptualizing a policy as broad and ambitious as Energiewende – Germany’s goal to transition nearly 100 percent of its electricity supply to renewable energy by 2050 – is one thing. Implementing it is another thing entirely. For this, ‘good governance’ is required – or as the Hertie School defines it: “an effective, efficient, and reliable s […]
  • RSS State Of The Climate

    • November 2014 National Overview
      The average contiguous U.S. temperature during November was 39.3°F, 2.4°F below the 20th century average. This ranked as the 16th coldest November in the 1895-2014 record, and was the coldest November since 2000. The average maximum (daytime) November temperature for the contiguous U.S. was 50.3°F, 2.4°F below the 20th century average and ranked as the 21st […]
    • November 2014 Global Analysis
      The combined average temperature over global land and ocean surfaces for November 2014 tied with 2008 as seventh highest in the 135-year period of record, at 0.65°C (1.17°F) above the 20th century average of 12.9°C (55.2°F). The global land surface temperature was 0.82°C (1.48°F) above the 20th century average of 5.9°C (42.6°F), the 13th highest for November […]
    • November 2014 Drought
      Please note that the values presented in this report are based on preliminary data. They will change when the final data are processed, but will not be replaced on these pages.
  • RSS Global Climate Change – Vital Signs of the Planet – News RSS Feed

    • NASA finds good news about forests and carbon dioxide
      A new NASA-led study shows that tropical forests may be absorbing far more carbon dioxide than many scientists thought, in response to rising atmospheric levels of the greenhouse gas. The study estimates that tropical forests absorb 1.4 billion metric tons of carbon dioxide out of a total global absorption of 2.5 billion — more than is absorbed by forests in […]
  • RSS Natural Hazards

    • Eruption at Fogo
      Hundreds of people were forced to flee their homes as lava headed for settlements within Fogo’s caldera.
  • Archives

  • Archives