by Daniel Brouse & Sidd Mukherjee
July 2026
A Probability Distribution of Humanity’s Next 200 Years
How likely are different futures for civilization as climate change accelerates?
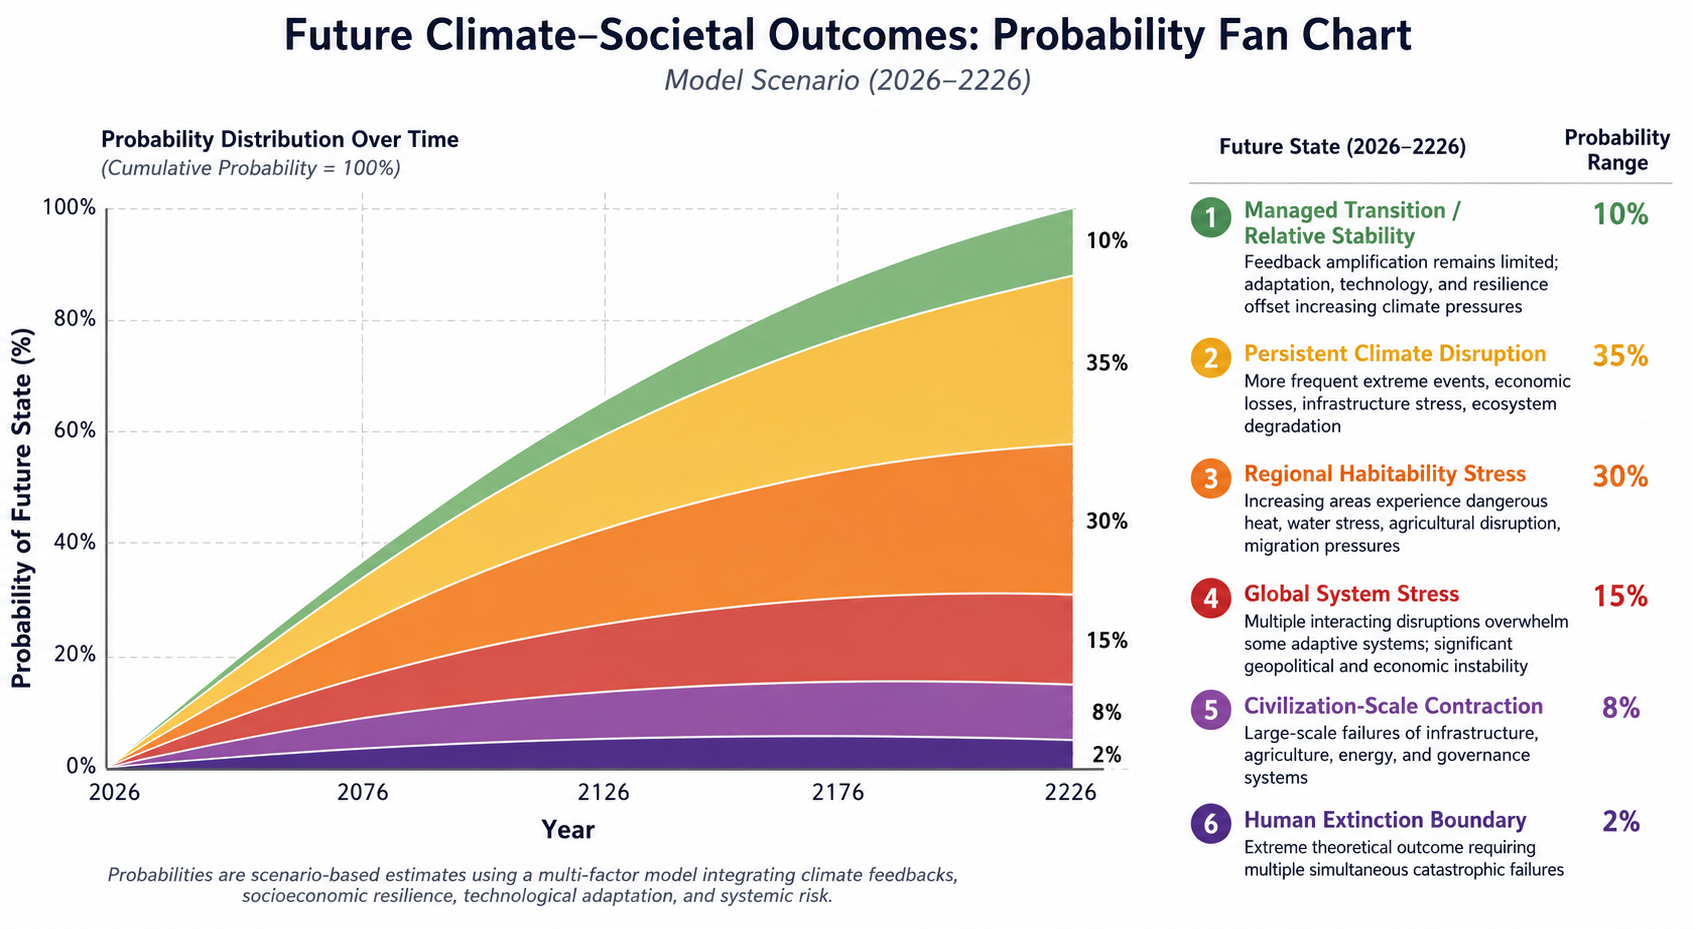
Here is a Climate-Societal Probability Fan Chart (2026–2226) that visualizes a model-based distribution of potential outcomes over the next two centuries.
Rather than asking “What will happen?”, the chart asks the more scientifically useful question:
“What is the probability distribution of plausible futures?”
The model incorporates nonlinear climate feedbacks, systemic interactions, adaptive capacity, technological progress, and societal resilience to estimate the relative likelihood of six broad scenarios:
🟢 10% — Managed Transition / Relative Stability
🟡 35% — Persistent Climate Disruption
🟠 30% — Regional Habitability Stress
🔴 15% — Global System Stress
🟣 8% — Civilization-Scale Contraction
⚫ 2% — Human Extinction Boundary
The important takeaway is that human extinction is not the central expectation of the model. The highest-probability outcomes involve increasing disruption, economic stress, migration, infrastructure challenges, and declining habitability across vulnerable regions—not the disappearance of humanity.
Understanding probability distributions is far more informative than focusing on a single prediction. As with weather forecasting or hurricane models, uncertainty is not ignorance—it is measurable.
Our goal is to move the conversation beyond sensationalism and toward evidence-based risk assessment grounded in systems science, nonlinear feedbacks, and probability.
Discussion and constructive criticism are welcome.
| Future State (2026–2226) | Probability Range | Framework Interpretation |
|---|---|---|
| 1. Managed Transition / Relative Stability | 10% | Feedback amplification remains limited; adaptation, technology, and resilience offset increasing climate pressures. |
| 2. Persistent Climate Disruption | 35% | More frequent extreme events, economic losses, infrastructure stress, and ecosystem degradation. |
| 3. Regional Habitability Stress | 30% | Increasing areas experience dangerous heat, water stress, agricultural disruption, and migration pressures. |
| 4. Global System Stress | 15% | Multiple interacting disruptions overwhelm some adaptive systems, producing significant geopolitical and economic instability. |
| 5. Civilization-Scale Contraction | 8% | Large-scale failures of infrastructure, agriculture, energy, and governance systems. |
| 6. Human Extinction Boundary | 2% | Extreme theoretical outcome requiring multiple simultaneous catastrophic failures. |
The distribution is not intended to be a literal prediction of where humanity will be in exactly 200 years. A 200-year horizon necessarily involves enormous uncertainty—seven generations means changes in technology, governance, economics, and adaptation capacity that cannot be known today.
The main purpose of the graph is to emphasize that human extinction remains a very low-probability outcome across the modeled scenarios. The more likely risks involve increasing climate disruption, ecosystem stress, and challenges to human systems.
Given that distinction, the most important actions are clear: reduce the primary driver of warming by transitioning away from fossil fuel combustion while simultaneously accelerating adaptation and resilience efforts. The goal is not to focus on an unlikely worst-case outcome, but to reduce the probability of disruptive pathways and improve the chances of a stable, adaptable future.
Climate change is often described as a simple process:
More greenhouse gases → Higher temperatures → More impacts
This explanation captures an important part of the process, but it does not fully describe how complex systems behave.
The Earth is not a machine with separate parts operating independently.
It is a connected system where:
Atmosphere ↔ Oceans ↔ Ice Systems ↔ Ecosystems ↔ Human Civilization
When one part changes, other parts respond.
Sometimes those responses reduce change.
Sometimes they amplify it.
The Nonlinear Acceleration Framework explores how connected responses can transform climate change from a gradual process into a system of interacting feedbacks.
The Earth operates as an interconnected network.
Changes do not remain isolated.
A disturbance in one system can propagate into another:
Atmosphere → Ocean → Cryosphere → Biosphere → Human Systems
For example:
Warmer Atmosphere → Increased Atmospheric Moisture → More Intense Rainfall → Flooding → Infrastructure Stress → Economic Impacts
The original warming signal has now moved through several connected systems.
A linear system assumes:
Small Change → Small Response
Example:
Temperature Increase → Gradual Increase in Climate Impacts
A nonlinear system recognizes:
Small Change → Amplified Response
Example:
Temperature Increase → Ice Loss → Reduced Reflectivity → More Solar Absorption → Additional Warming
The response becomes larger because the system itself has changed.
The important question is not only:
How much is something changing?
The deeper question is:
Is the rate of change itself increasing?
A vehicle traveling at a constant speed is different from one accelerating.
Climate systems can also experience acceleration.
Examples:
Ocean Warming → Increased Ocean Heat Storage → Stronger Marine Heatwaves
Ice Loss → Faster Surface Change → Additional Warming Influence
Atmospheric Warming → Increased Moisture Capacity → More Extreme Precipitation
The framework focuses on changing rates of change.
A single domino falling is different from a connected chain of dominoes falling.
Climate feedbacks work similarly.
One process can activate another:
Warming → Ice Loss → Reduced Surface Reflectivity → Increased Energy Absorption → Additional Warming
Ocean Heating → Increased Evaporation → Higher Atmospheric Moisture → Stronger Weather Extremes → Infrastructure Stress
Heat Stress → Vegetation Loss → Reduced Carbon Storage → Additional Climate Stress
The concern is not one feedback.
The concern is the interaction among many feedbacks.
A complex system behaves differently from a collection of independent parts.
A network contains:
Connections → Feedback Loops → Thresholds → Emergent Behavior
Some connections are weak.
Some connections are powerful.
As connections strengthen:
Individual Changes → Coupled Responses → Cascading Effects
A highly connected system can become more sensitive to disturbances.
Complex systems can occupy different states.
The framework describes possible transitions:
Balanced Conditions → Limited Feedback Amplification → Effective Adaptation
More Extreme Events → Greater Damage → Increasing Economic and Social Costs
Climate Extremes → Agricultural Stress → Water Challenges → Migration Pressure
Multiple Simultaneous Disruptions → Reduced Recovery Capacity → Increased Vulnerability
Infrastructure Stress → Economic Instability → Reduced Adaptive Capacity → Systemic Decline
Severe Environmental Stress → Loss of Adaptive Capacity → Human Survival Becomes Increasingly Challenging
This represents a theoretical upper boundary, not a prediction.
The future is not a single path.
It is a range of possible pathways.
A probability envelope represents how possible futures shift as conditions change.
The distribution depends on:
Feedback Strength → System Coupling → Vulnerability → Resilience → Future Outcomes
Increasing amplification can shift probability toward more disruptive states.
Increasing resilience can shift probability toward more stable states.
Temperature is only one component.
Risk emerges from interactions:
Climate Stress → System Connections → Human Vulnerability → Societal Consequences
Examples:
Heat → Crop Stress → Food System Pressure → Economic Effects
Flooding → Infrastructure Damage → Recovery Costs → Reduced Resilience
Drought → Ecosystem Stress → Reduced Natural Buffering → Additional Vulnerability
Humans are not outside the climate system.
Civilization depends on:
Agriculture → Energy → Transportation → Infrastructure → Stable Conditions
Climate impacts can create cascading effects:
Extreme Weather → Infrastructure Damage → Economic Stress → Reduced Adaptation Capacity → Greater Vulnerability
However, humans can also create stabilizing responses:
Climate Challenge → Innovation → Adaptation → Improved Resilience
The future depends on which feedbacks dominate.
Complex systems are sensitive to small changes.
A small difference today can create a large difference later.
This is often called:
In a connected system:
Small Disturbance → Network Interaction → Diverging Future Pathways
This does not mean prediction is impossible.
It means understanding the system requires understanding the connections within the system.
The Nonlinear Acceleration Framework proposes:
Climate change is not only:
Increasing Temperature
It is also:
Increasing Interactions → Increasing Feedbacks → Increasing Acceleration → Changing Future Probabilities
The key question becomes:
How does a changing Earth system alter the probability of different futures?
The framework can be summarized in five principles:
Atmosphere ↔ Ocean ↔ Ice ↔ Ecosystems ↔ Civilization
Changes propagate through networks.
Initial Disturbance → Feedback Activation → Larger Response
Change → Changing Rate of Change → Accelerating System Response
Multiple Pathways → Different Outcomes → Shifting Probabilities
Climate Stress → Human Response → Adaptation or Increased Vulnerability
The purpose of the Nonlinear Acceleration Framework is not to predict one guaranteed future.
Its purpose is to understand how complex systems evolve when multiple pressures interact.
A changing climate is not simply:
A Warmer Planet
It is:
A Changing Network of Interacting Systems
Understanding that network requires looking beyond individual events and examining the connections that link them together.
The future depends not only on the changes we create, but on how those changes interact.
* Our probabilistic, ensemble-based climate model — which incorporates complex socio-economic and ecological feedback loops within a dynamic, nonlinear system — projects that global temperatures are becoming unsustainable this century. This far exceeds earlier estimates of a 4°C rise over the next thousand years, highlighting a dramatic acceleration in global warming. We are now entering a phase of compound, cascading collapse, where climate, ecological, and societal systems destabilize through interlinked, self-reinforcing feedback loops.
We examine how human activities — such as deforestation, fossil fuel combustion, mass consumption, industrial agriculture, and land development — interact with ecological processes like thermal energy redistribution, carbon cycling, hydrological flow, biodiversity loss, and the spread of disease vectors. These interactions do not follow linear cause-and-effect patterns. Instead, they form complex, self-reinforcing feedback loops that can trigger rapid, system-wide transformations — often abruptly and without warning. Grasping these dynamics is crucial for accurately assessing global risks and developing effective strategies for long-term survival.
Feedback Loops →
Tipping Points →
Acceleration →
Domino Effect
Feedback loops amplify climate change and can push interconnected Earth systems past critical tipping points. As tipping points are crossed, they can trigger additional feedback loops and destabilize other climate systems. This cascading "Domino Effect" compresses timescales, accelerates change, and increases the risk of rapid, nonlinear climate transformations.