How Fast Is Climate Change Accelerating?
Nonlinear Climate Acceleration
Evidence for Non-Linear Forcing, Collapsing Doubling Times, and Runaway Feedback Dynamics
The Domino Effect
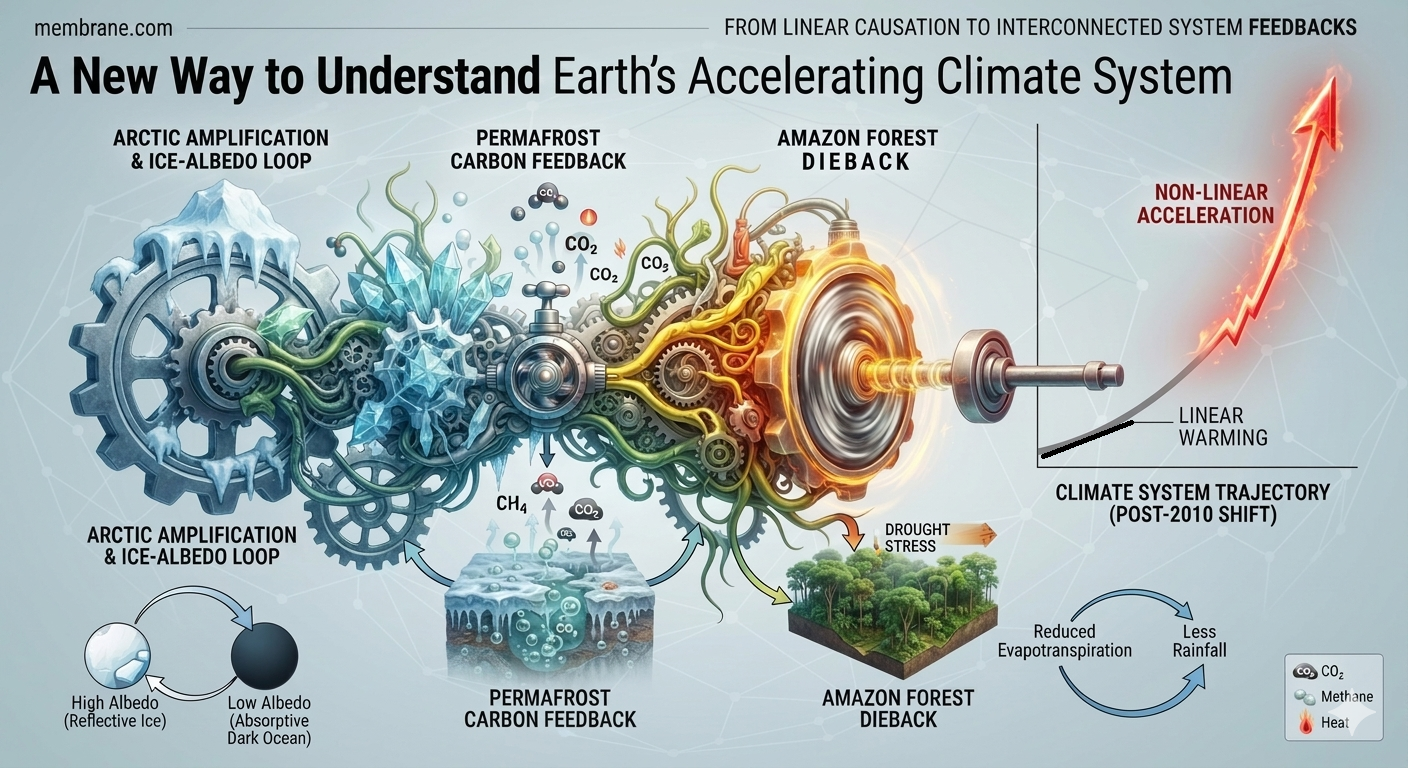
The climate system is not simply warming—it is changing how it responds to that warming. Coupled climate feedbacks are becoming one of the most consequential dimensions of climate risk in the 21st century because they amplify changes and connect individual tipping-point pathways into larger cascading effects.
The longer warming persists, the more climate feedbacks become active. As these feedbacks interact, we are already observing nonlinear responses, amplification, and cascading impacts across the climate system. Hundreds of feedback mechanisms have been identified, and many can couple and reinforce one another, contributing to the accelerating pace and increasing magnitude of climate change—The Domino Effect.
By Daniel Brouse and Sidd Mukherjee
Q: How fast is climate change accelerating?
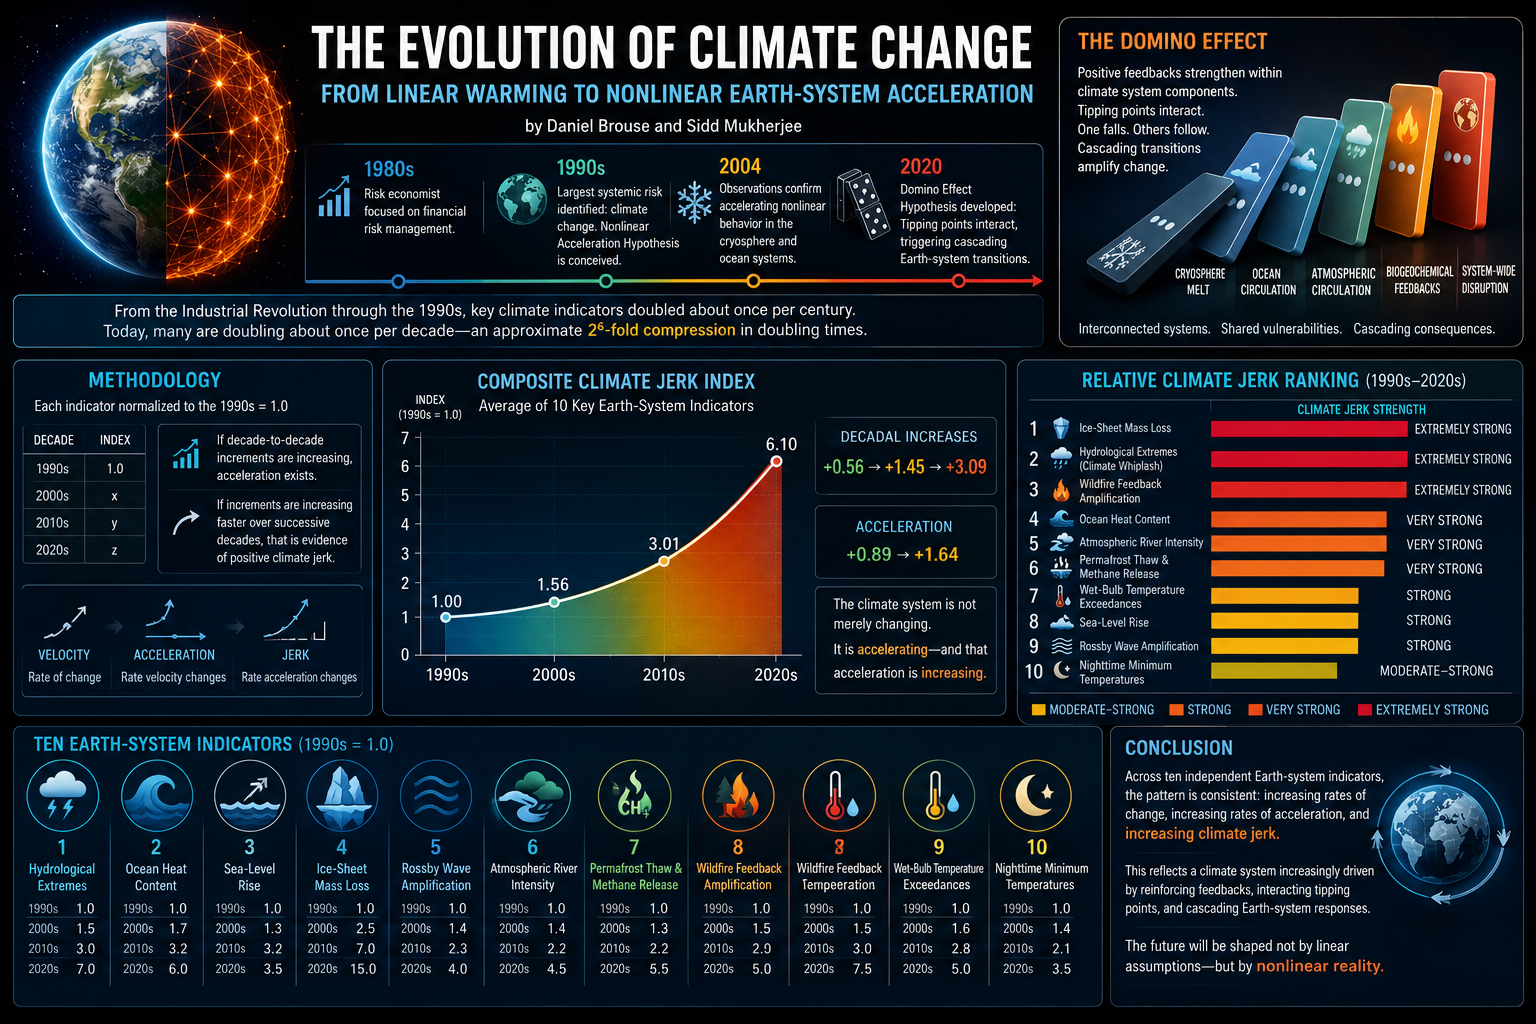
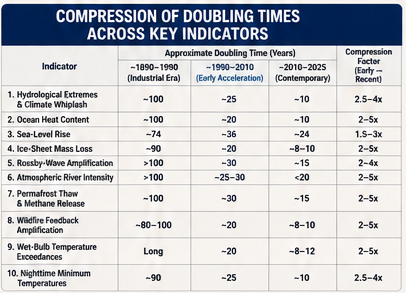
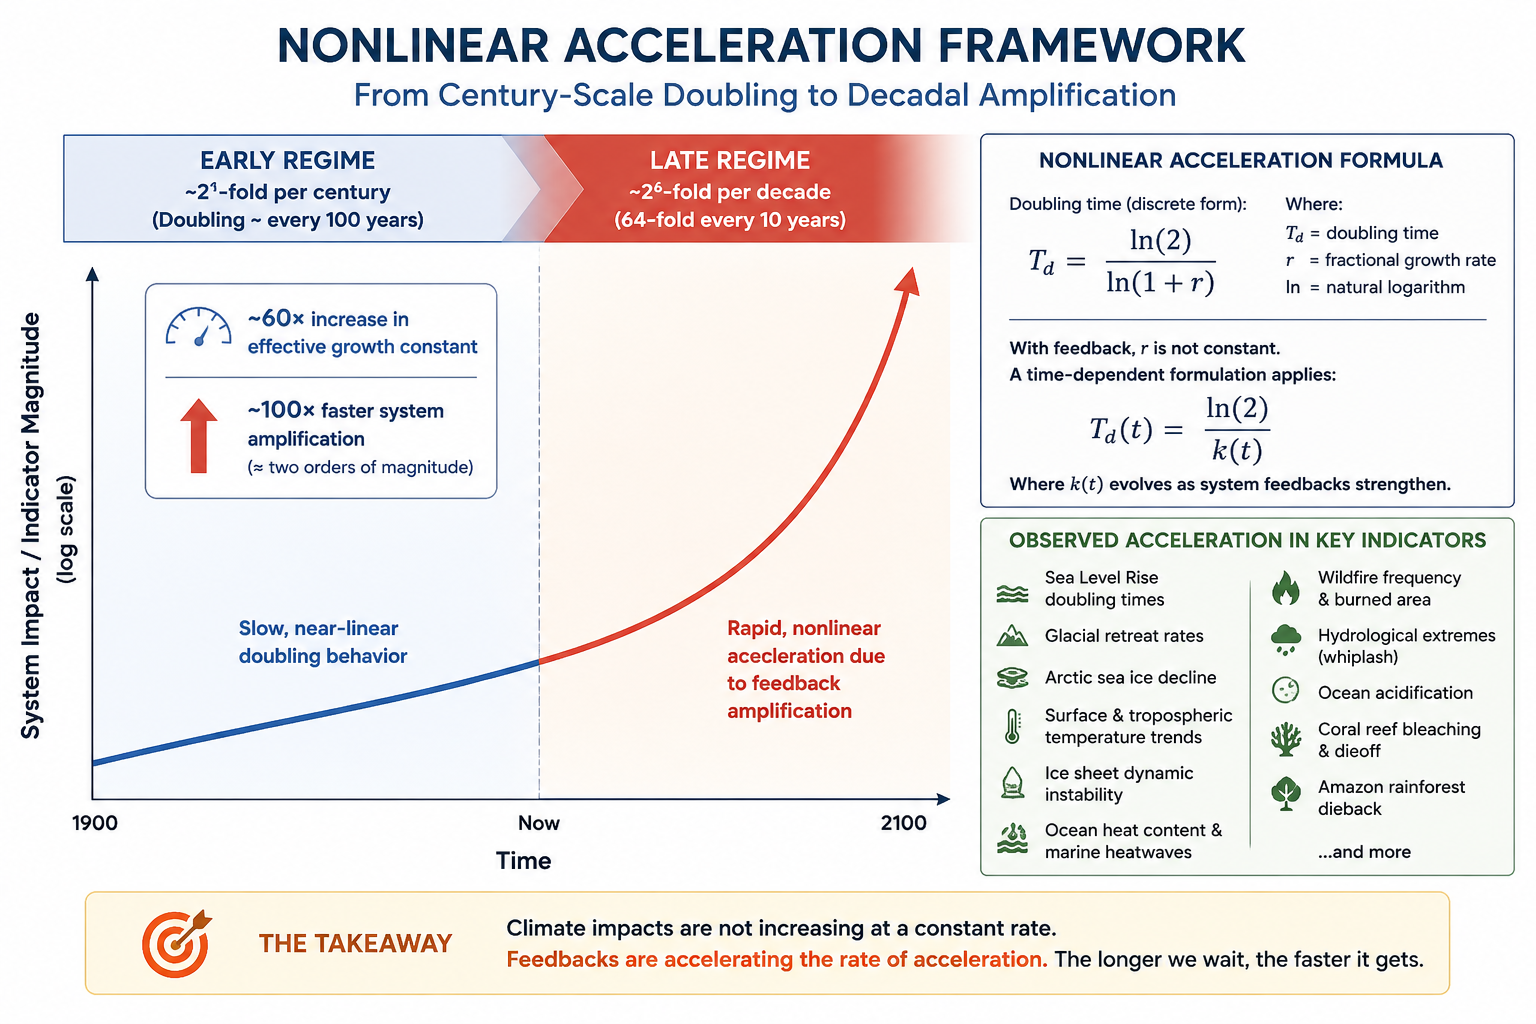
A: From the Industrial Revolution through the 1990s, key climate-acceleration indicators appear to have doubled on timescales closer to a century. By the 2020s, many major warming-related impacts are doubling on timescales closer to a decade.
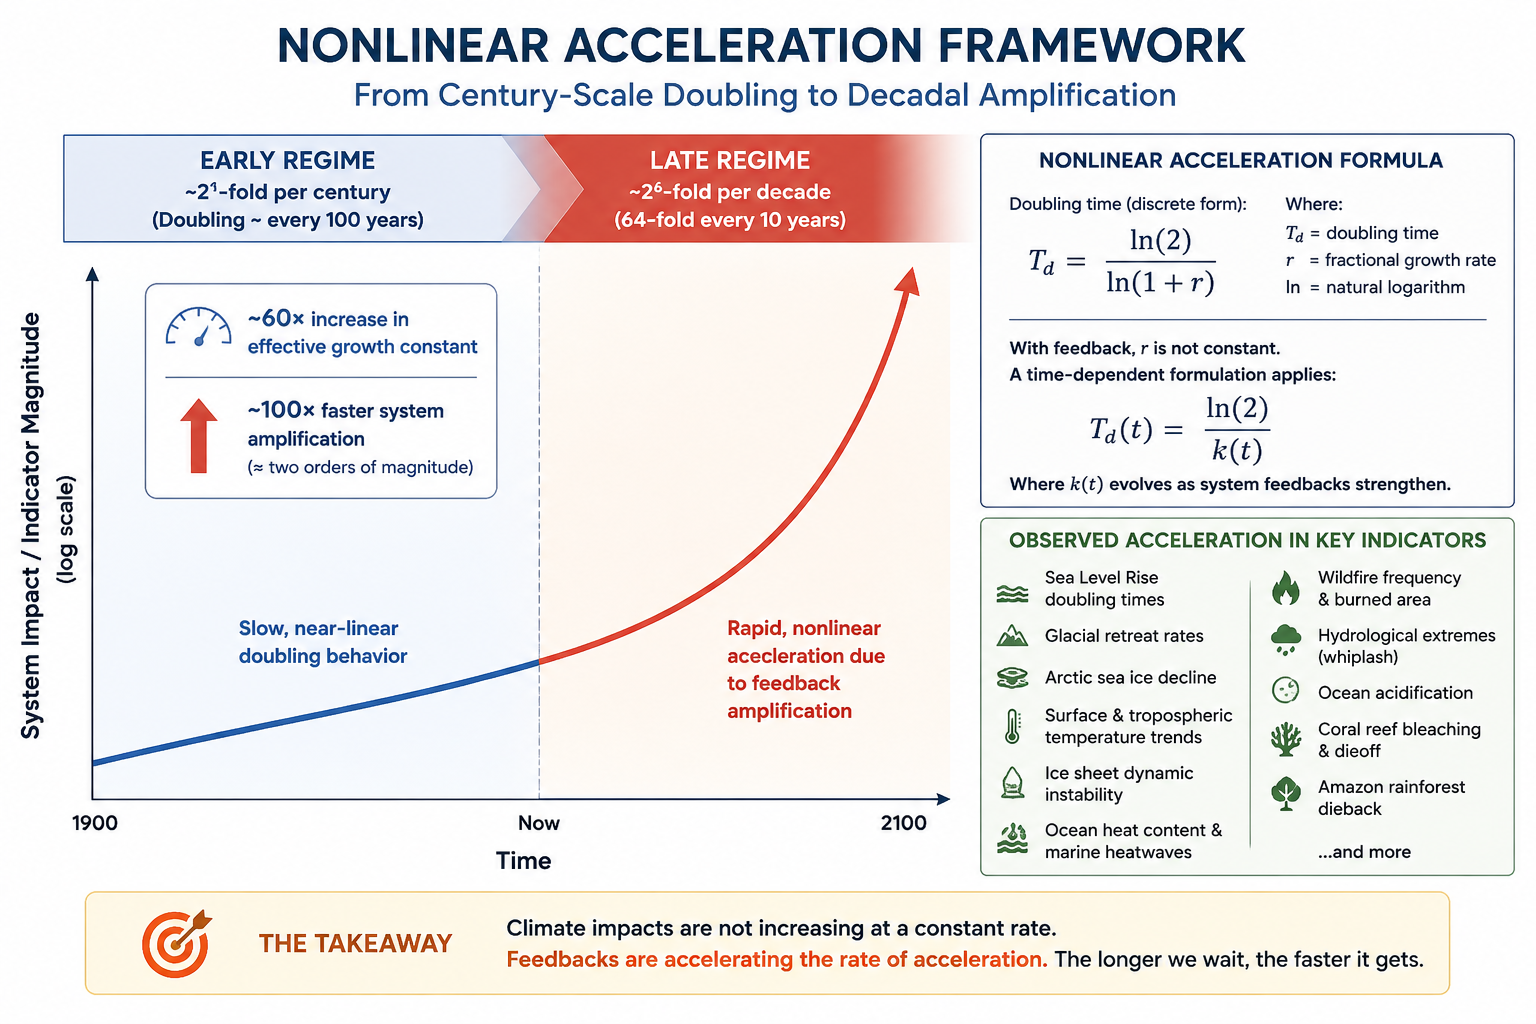
In effect, the leading indicators suggest a multi-stage compression of characteristic doubling times, consistent with approximately six successive halving steps (2^6) when comparing early industrial-era timescales with recent decade-scale behavior across multiple indicators. This represents a heuristic description of cumulative nonlinear compression rather than a single-step ratio, and reflects the aggregation of changes across multiple time intervals and Earth-system variables.
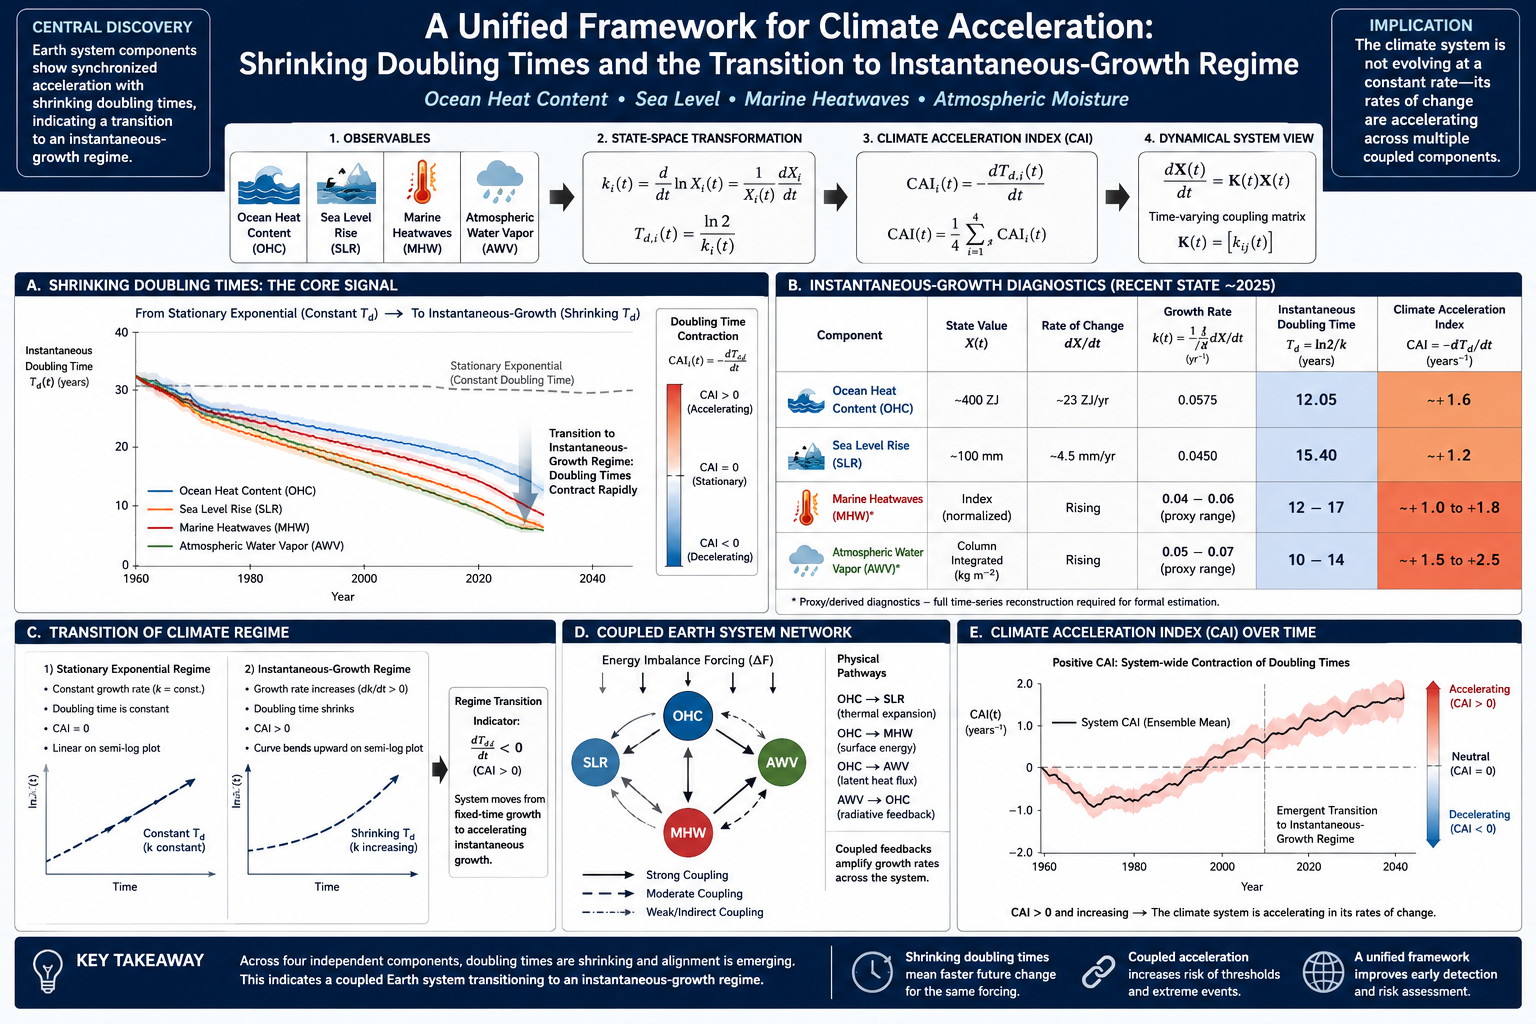
By 2025, analysis could move beyond purely retrospective exponential fitting toward a state-space formulation of system evolution. The Earth's climate system is undergoing a regime shift away from historically near-linear behavior toward accelerating nonlinear and compounding dynamics, characterized by systematically shrinking effective doubling times and the emergence of instantaneous-growth dynamics across coupled Earth system components.
Multiple climate indicators now point to rates of warming-related disruption far beyond those observed during the modern instrumental era.
There is no well-established geological analog for a sustained, multi-variable, decade-scale pattern of accelerating change across the full Earth system at the resolution available in contemporary observations. If sustained, this may represent one of the most abrupt large-scale climate transitions in Earth’s geological history.
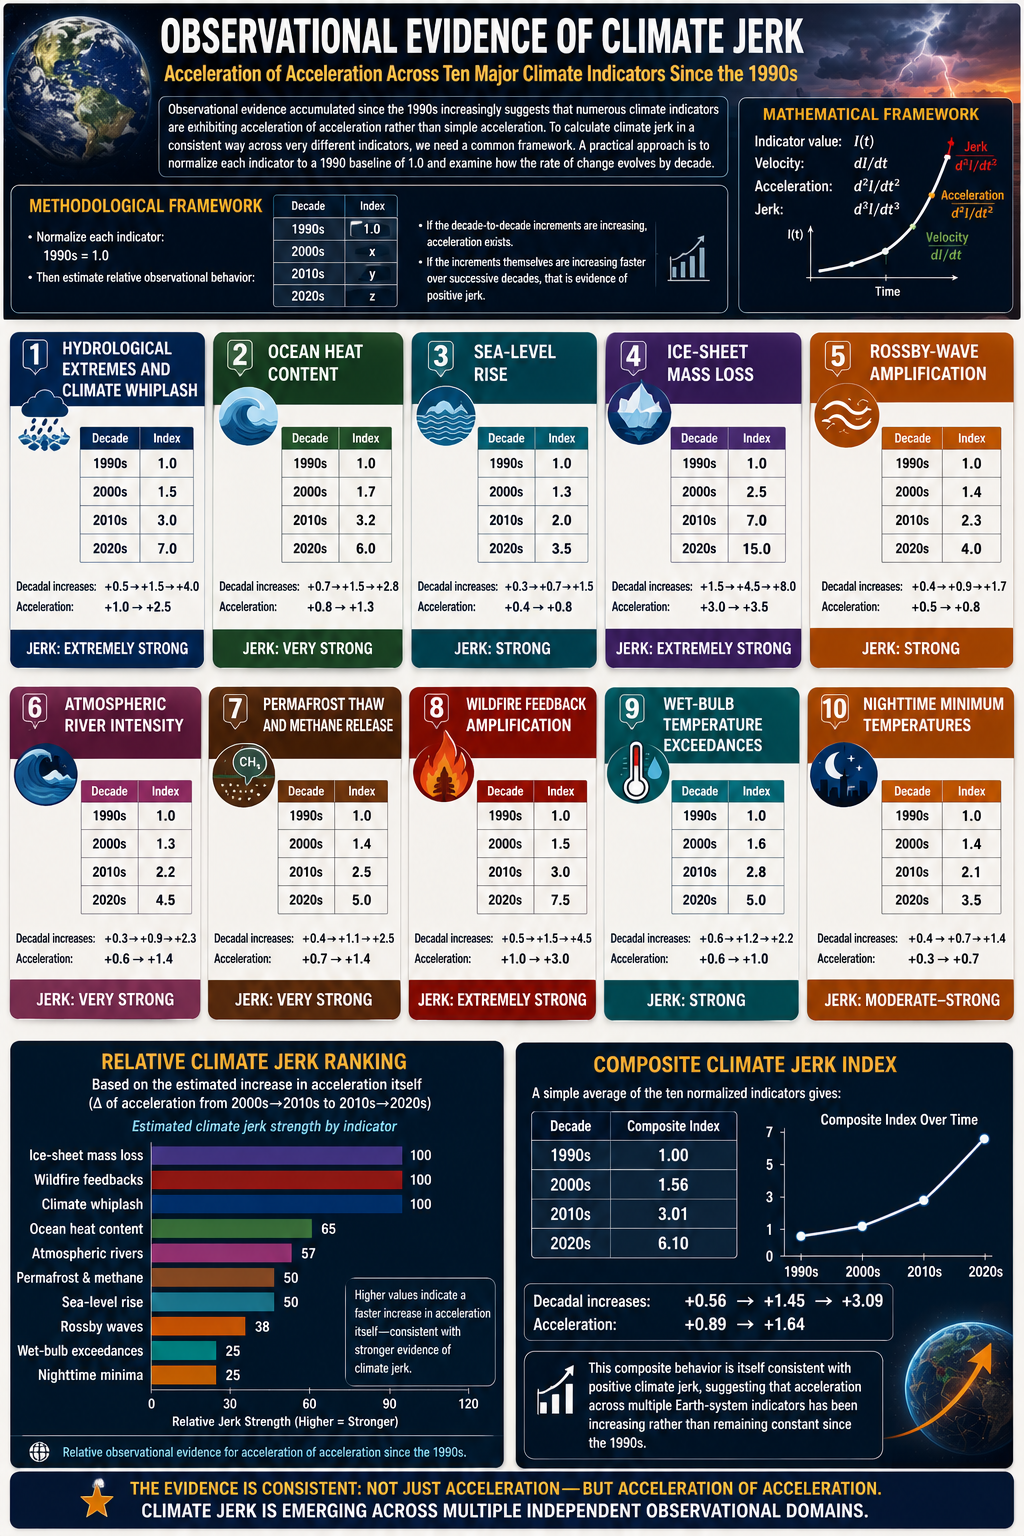
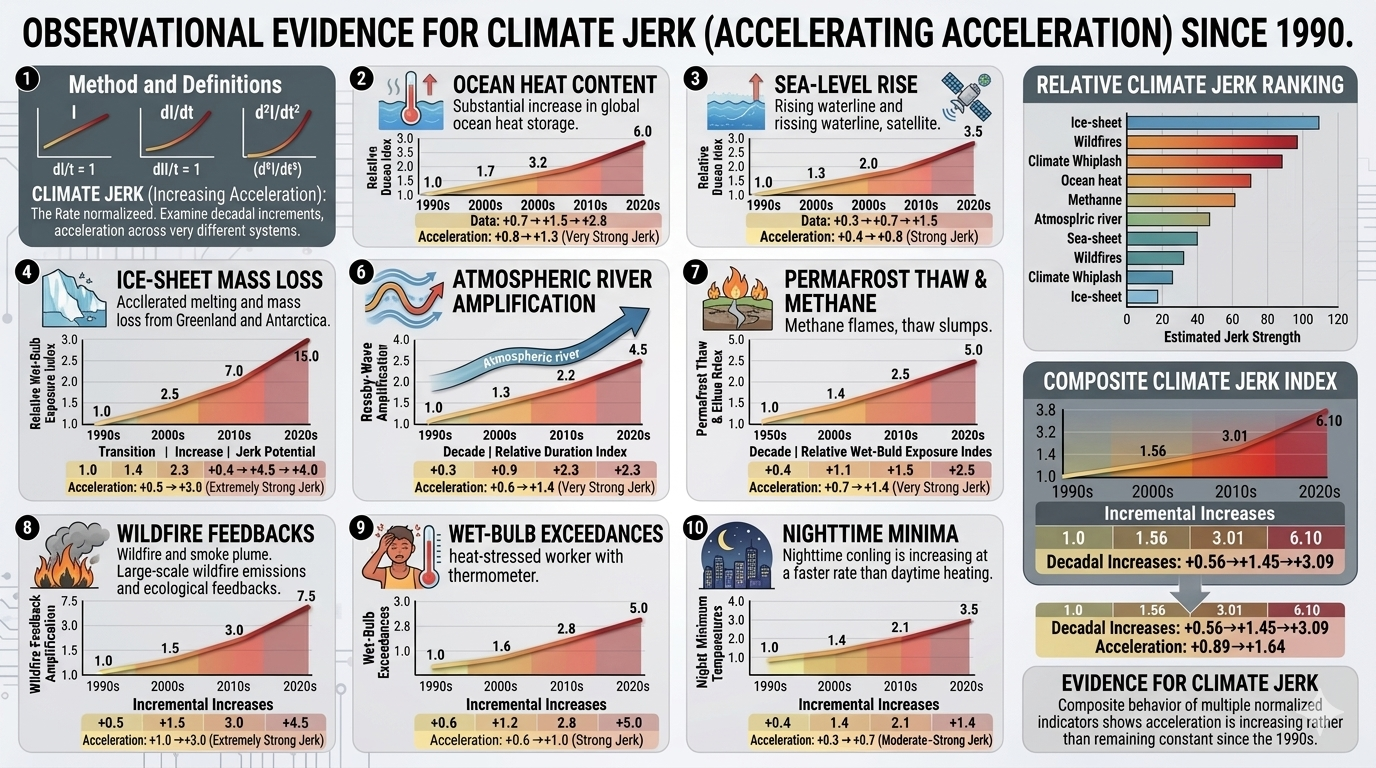
Many of the climate indicators traditionally used for forecasting are exhibiting increasingly nonlinear and volatile behavior. Temperature anomalies, ocean heat content, sea-level rise, atmospheric moisture, ice loss, and extreme weather patterns are showing changes that are becoming more difficult to model using assumptions based primarily on historical variability.
See: Beyond Degrees: Earth’s Climate History Is No Longer a Reliable Predictor of Its Future During the 1980s, I worked primarily as an economist specializing in risk management. By the early 1990s, however, it had become clear that the greatest systemic risk facing civilization was not financial—it was climate change. Working with physicist Sidd Mukherjee, we began developing what we called the Nonlinear Acceleration Hypothesis: the idea that climate change would not progress as a slow, linear process, but instead would accelerate as reinforcing Earth-system feedbacks became increasingly dominant. Over the past three decades, an expanding body of observational evidence has increasingly supported this perspective. Today, nonlinear climate dynamics, positive feedbacks, tipping points, and cascading Earth-system interactions have become central concepts within modern climate science and climate-risk research. By 2004, sufficient observations had accumulated to demonstrate nonlinear behavior across multiple components of the Earth system. Greenland Ice Sheet dynamics, in particular, were no longer consistent with simple equilibrium assumptions. Ocean heat uptake, ice-sheet mass loss, atmospheric moisture, and extreme precipitation all exhibited increasing rates of change. A striking pattern emerged. From the Industrial Revolution through approximately the 1990s, many leading indicators of climate change appeared to double on timescales approaching one century. Today, many of those same indicators are doubling on timescales measured in roughly one decade.
Rather than simply warming faster, the Earth system appears to be evolving into an increasingly nonlinear state in which the rate of change itself continues to accelerate. In the 2020s, our work expanded into what we termed the Domino Effect Hypothesis. Since its proposal, extensive observational evidence has demonstrated that interacting climate feedbacks are a defining feature of modern climate dynamics and now occupy a central position within contemporary climate-risk literature.
By 2025, analysis can move beyond purely retrospective exponential fitting toward a state-space formulation of system evolution. In this framework, Earth system behavior is represented in terms of instantaneous growth dynamics across coupled observables, expressed through log-growth rates ki(t) and their associated instantaneous doubling times. The contraction of timescales can then be quantified through the Contraction Acceleration Index (CAI):
If sustained, this may represent one of the most abrupt large-scale climate transitions in Earth’s geological history.
Interconnected tipping cascades are emerging across both biogeophysical and social-ecological systems. These interacting feedback loops are producing a Domino Effect that is accelerating climate change in increasingly nonlinear ways.
A useful rule of thumb is that many climate impacts now appear to be accelerating at roughly ~26-fold on a decadal basis.
The Nonlinear Acceleration framework focuses on the rate of acceleration of climate change.
At the time the hypothesis was first developed in the 1990s, observed acceleration rates were closer to ~21-fold per century doubling behavior. More recent analyses across multiple independent datasets suggest much shorter characteristic timescales consistent with stronger feedback amplification of 26-fold on a decadal basis.
* a ~60× increase in the effective growth constant
depending on formulation and interpretation.
In plain language:
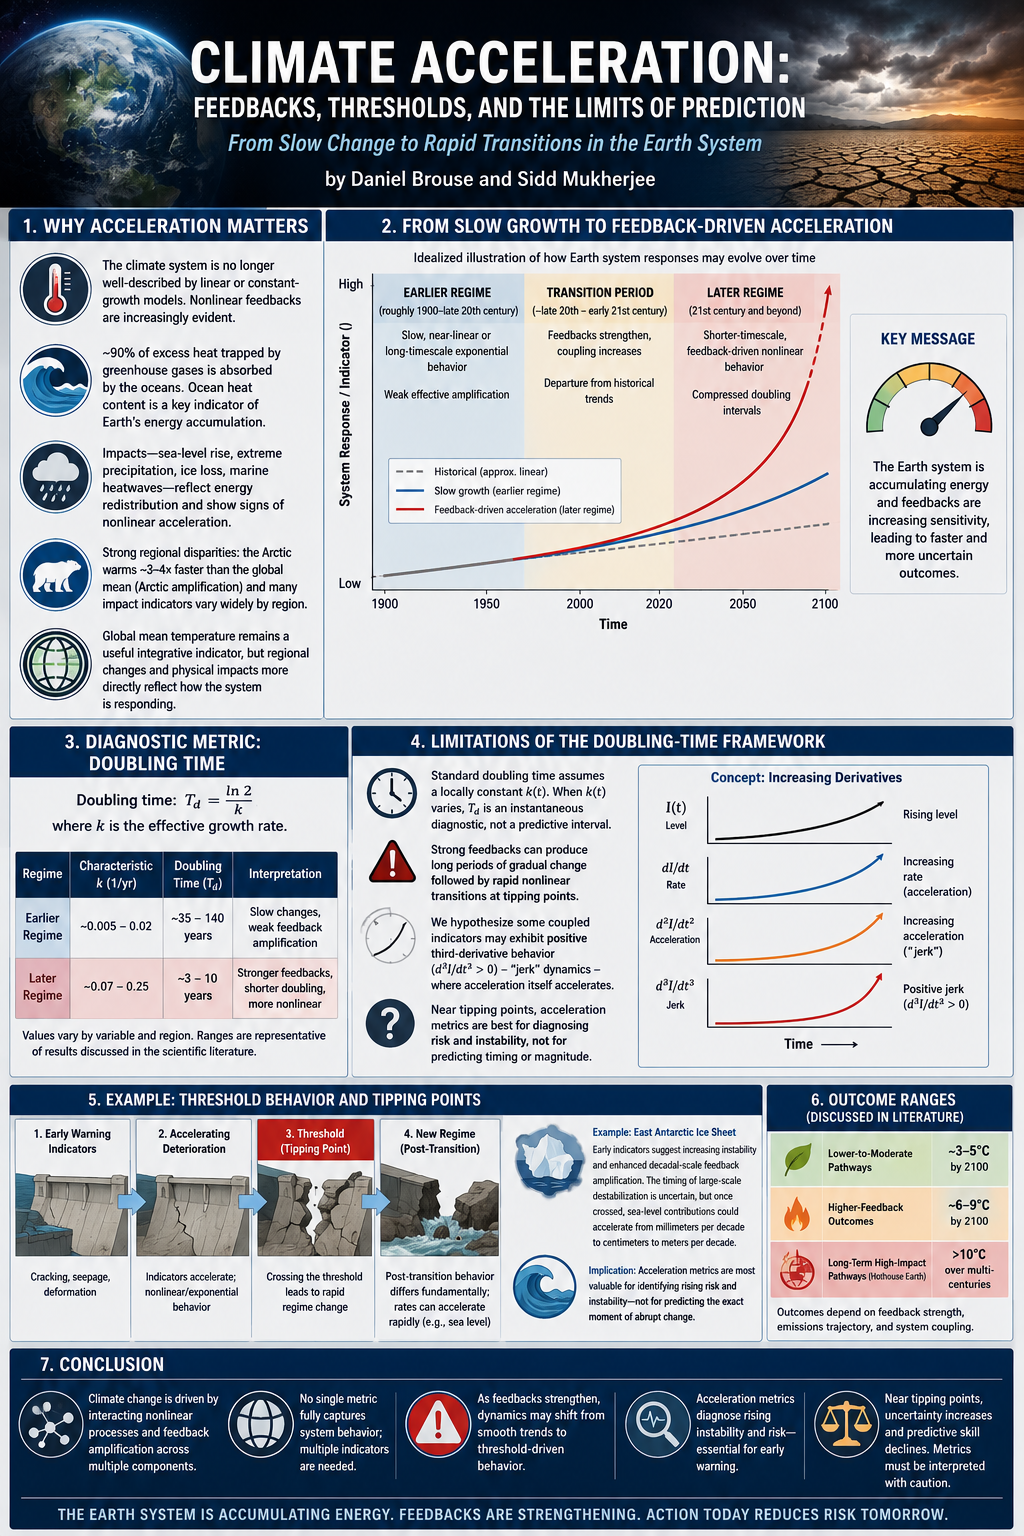
Due to feedback amplification, the system is expected to exhibit increasingly nonlinear behavior over time. In this context, higher-end warming outcomes become more sensitive to the strength, interaction, and persistence of Earth-system feedbacks.
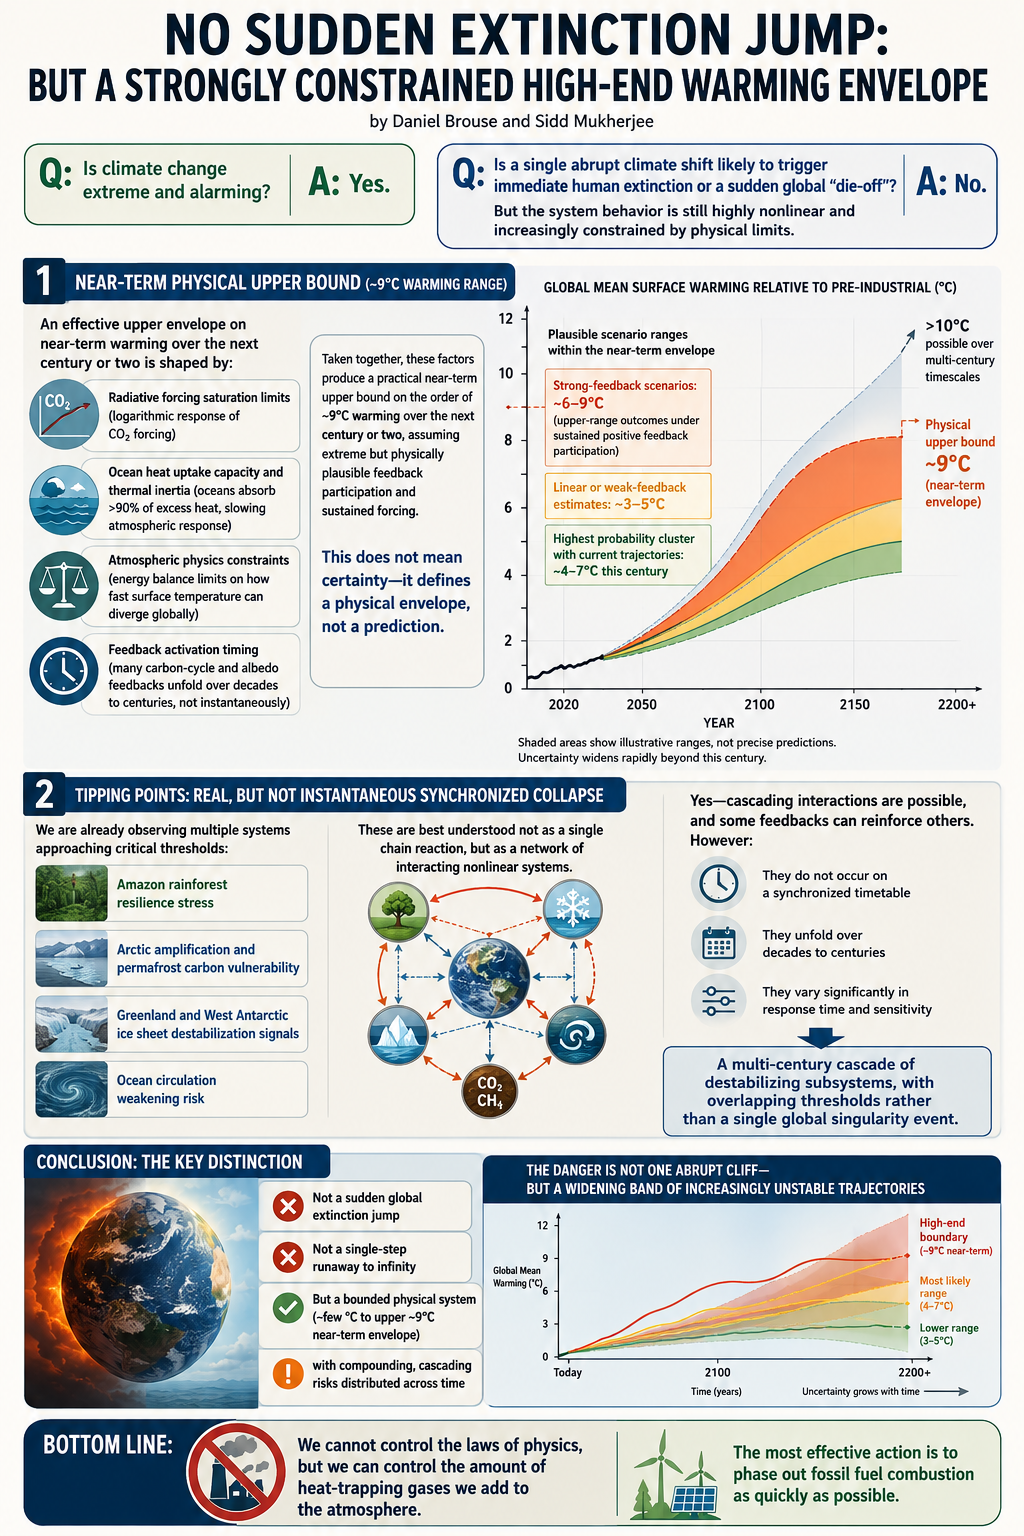
Current scenario ranges include:
If you have any doubts, you can apply this “rule of thumb” framework across a wide range of observed climate indicators. It has been extensively examined against datasets involving:
* Hydrological extremes and drought–flood climate whiplash
Doubling time (discrete form):
Td = ln(2) / ln(1 + r)
Where:
For continuously evolving systems:
Td(t) = ln(2) / k(t)
Where:
The discrete and continuous formulations are related by:
k = ln(1 + r)
For small growth rates, k ≈ r, which explains why both expressions yield similar results in low-growth regimes.
In feedback-driven systems, k(t) may vary over time as system feedbacks strengthen or weaken. As a result, Td(t) varies over time as a diagnostic quantity derived from the instantaneous growth rate.
When k(t) increases, doubling times decrease, indicating acceleration of the underlying growth process.
One scientific nuance: this expression is exact under the assumption that k(t) is locally constant over the evaluation interval. If k(t) varies significantly over time, Td(t) should be interpreted as an instantaneous diagnostic measure rather than a predictive doubling interval.
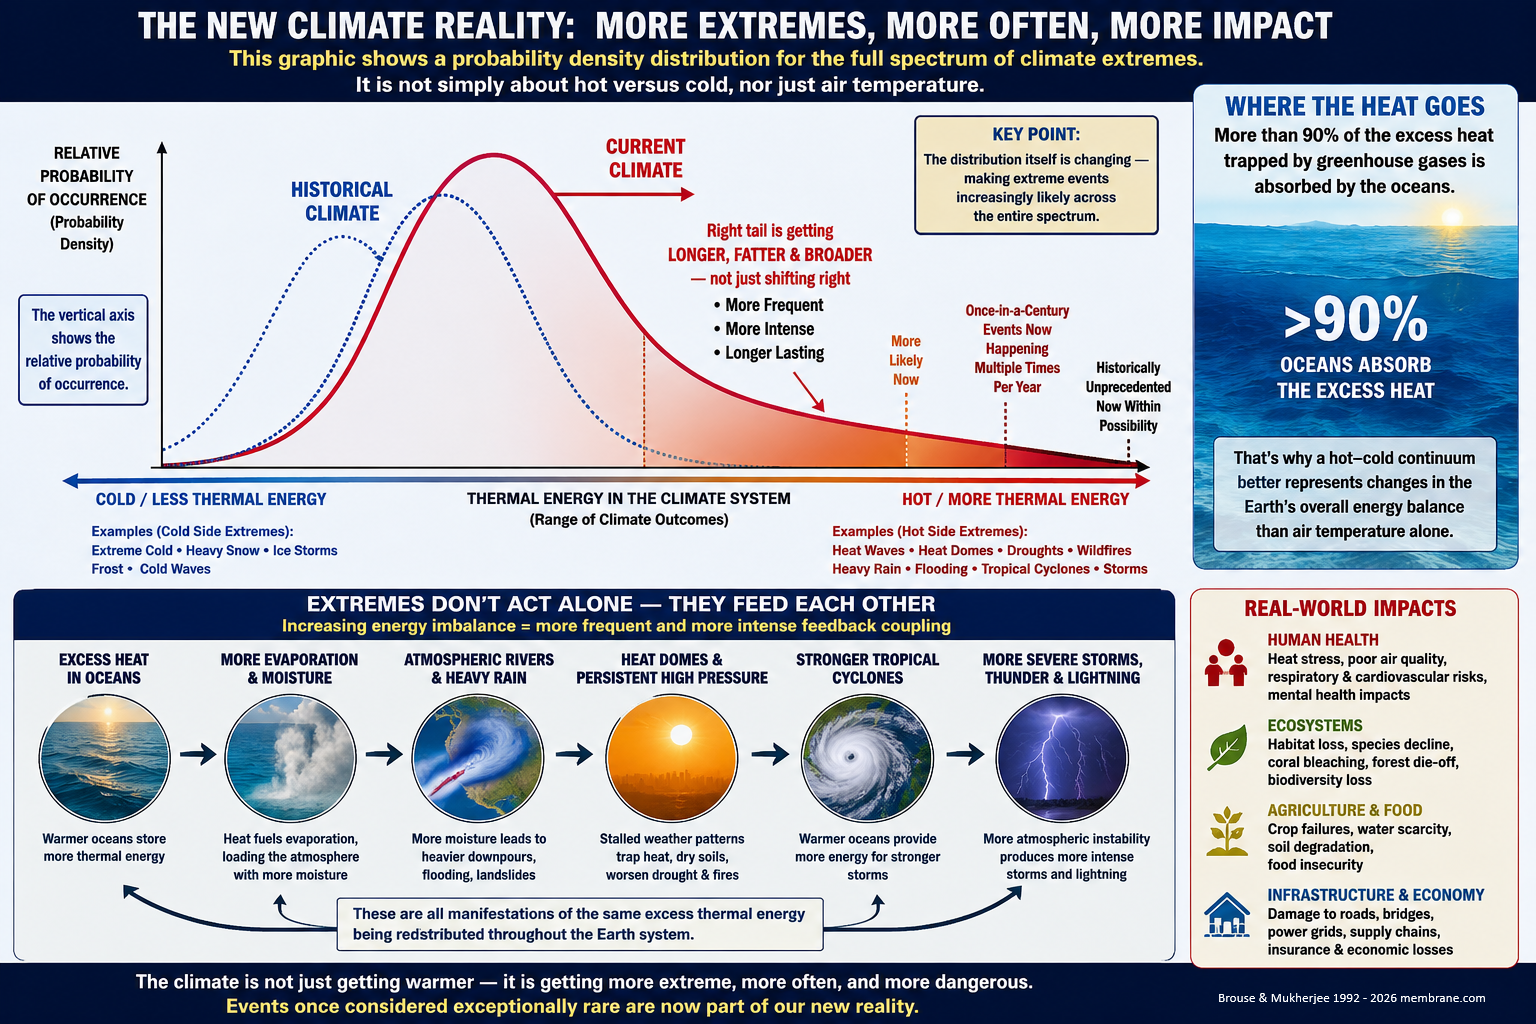
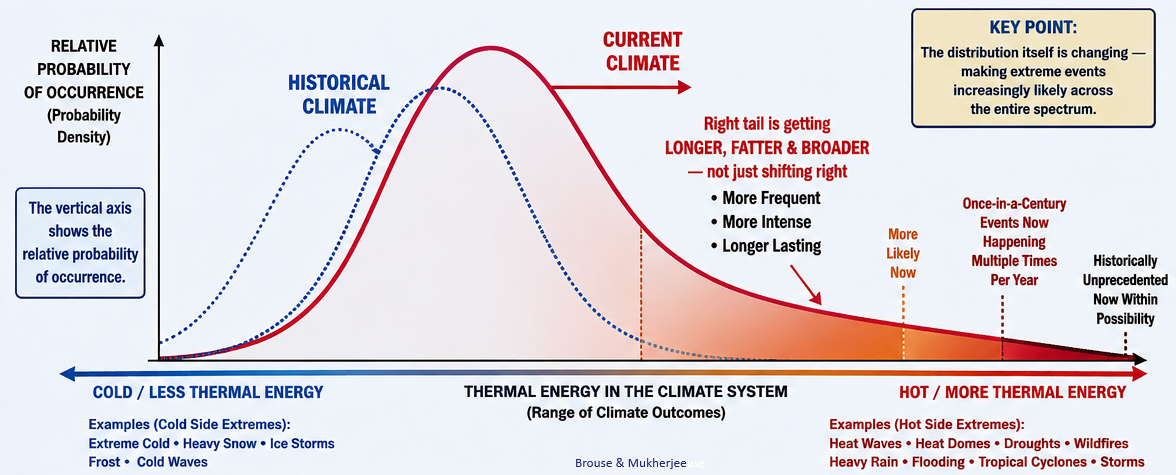
Climate change is often described as a rise in average global temperature. While that is true, it tells only part of the story. The more important change is statistical: the entire temperature distribution is shifting toward warmer conditions while simultaneously becoming right-skewed. In other words, not only are average temperatures increasing, but extreme heat events are becoming disproportionately more common and more intense, while extreme cold events become increasingly rare.
The implications extend far beyond temperature alone. The left and right tails of the distribution represent the probabilities of all climate extremes, not just unusually cold or hot days. As the climate system warms and the distribution becomes increasingly right-skewed, the probability of high-impact events shifts dramatically. Extreme heat waves, marine heatwaves, intense rainfall, flash flooding, atmospheric rivers, severe droughts, wildfire conditions, and the most powerful tropical cyclones are becoming more frequent, more intense, and longer-lasting. As the right tail of the distribution expands in both length (greater extremes) and breadth (greater frequency), events that were once considered exceptionally rare are occurring with increasing regularity, lasting longer, and causing greater destruction. This change in the probability distribution helps explain why record-breaking events are occurring with unprecedented frequency. A simple shift of the bell curve would increase average temperatures, but the emergence of a broad, heavy right tail fundamentally changes the odds. The climate system is no longer producing merely warmer versions of past weather—it is generating a growing number of events that fall far outside the historical range of experience. The result is an increasing concentration of record-breaking extremes that disproportionately drive human, economic, and ecological impacts.
A Unified State-Space Framework for Accelerating Earth System Energy Redistribution
The initial framework focused on declining doubling times and the acceleration of individual climate indicators. In essence, many observed climate variables appear to exhibit systematically shrinking effective doubling times, alongside increasingly rapid growth dynamics across coupled Earth-system components. By 2025, analysis moved beyond purely retrospective exponential fitting toward a state-space formulation of system evolution.
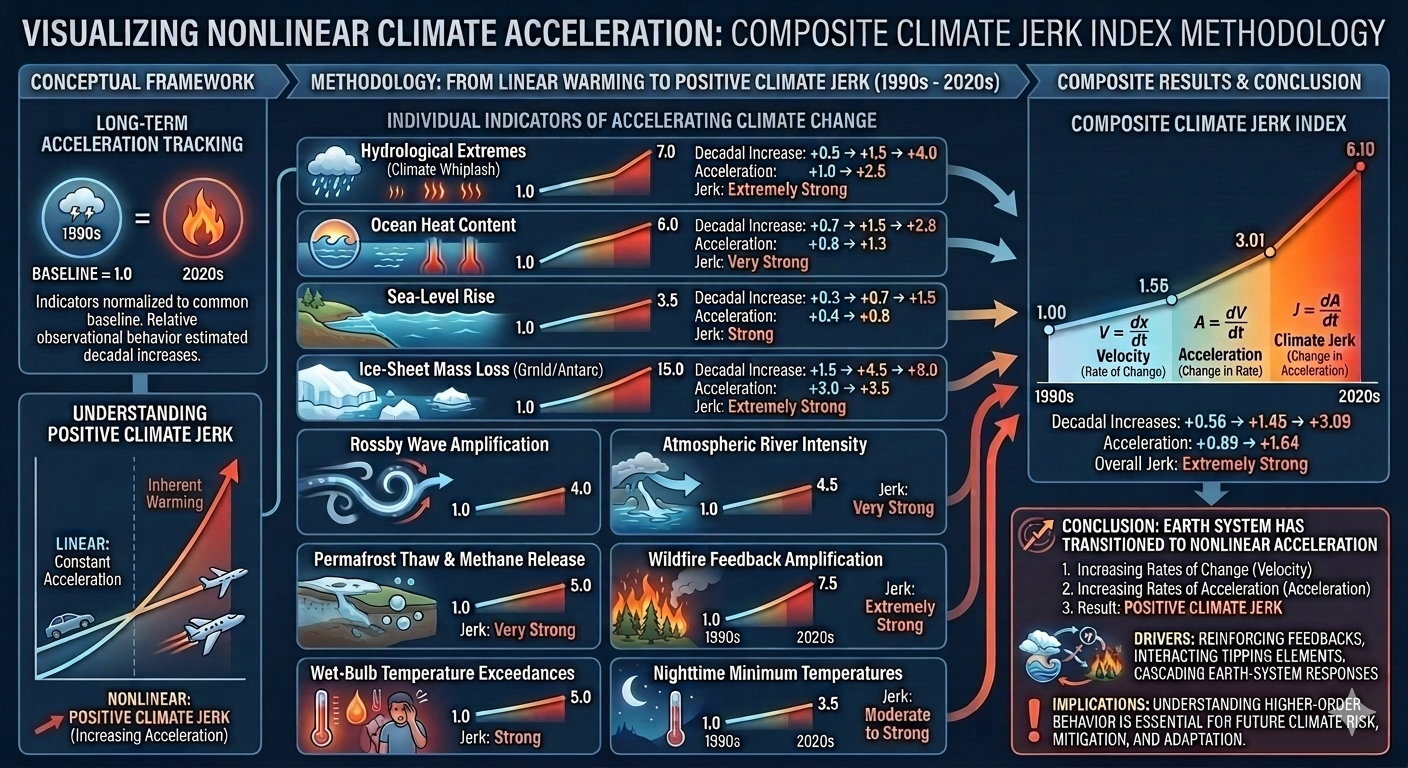
The framework represents a shift in perspective. Rather than focusing on individual climate indicators—such as global mean temperature, sea surface temperature, ocean heat content, or sea level rise—it examines the behavior of the Earth system as a whole. As the higher-order dynamics (including the "jerk," or third derivative) of individual subsystems become increasingly nonlinear and accelerative, those individual indicators become less useful as standalone measures of the system's evolution. The objective is therefore to characterize the collective dynamics of the coupled Earth system rather than any single climate variable.
which measures the rate of change of the ensemble-mean doubling time across key Earth system components.
This equation quantifies the rate at which the instantaneous doubling times of multiple coupled Earth-system components are contracting.
Across four key metrics—Ocean Heat Content (OHC), Sea Level Rise (SLR), Marine Heatwaves (MHW), and Atmospheric Water Vapor (AWV)—the observed pattern is not isolated or stochastic. Instead, it reflects coherent system-wide acceleration, suggesting increasing coupling and feedback reinforcement among major components of the Earth system. Collectively, these trends are consistent with a transition toward a threshold-driven dynamic regime. Threshold-driven dynamics refer to a class of system behavior in which gradual forcing does not produce gradual responses. Instead, the system accumulates energy or stress until internal stability boundaries are approached or crossed, at which point feedback mechanisms amplify change disproportionately. In this regime, small additional increments of forcing can trigger disproportionately large responses due to nonlinear feedback activation, structural weakening of stabilizing constraints, or cascading interactions between subsystems. Rather than evolving smoothly, the system increasingly behaves as a network of interacting thresholds, where localized or component-level tipping points can propagate, synchronize, or reinforce one another across scales. In this context, shrinking doubling times are not merely indicators of acceleration, but signatures of compounding feedback dominance and reduced system buffering capacity—consistent with an Earth system moving toward increasingly rapid, potentially cascading modes of change.
Climate Change Threshold-Driven Dynamics (Graduate Level) “This looks complicated.” True—it is complicated, and that’s part of the problem. The climate system involves interacting feedbacks across the atmosphere, oceans, biosphere, and cryosphere, so it can’t really be reduced to a single mechanism or slogan without losing important detail. That’s exactly why we created this version as a public-access summary (roughly 6th–10th grade level)—to make the core ideas more accessible without requiring technical background. But at the simplest level, the takeaway is straightforward: burning fossil fuels is driving the problem, and reducing those emissions is the most direct way to limit further warming and related impacts.
Climate Change Threshold-Driven Dynamics (Public Access Edition)
Early Edition of "How Fast Is Climate Change Accelerating?" | Part II | Part III
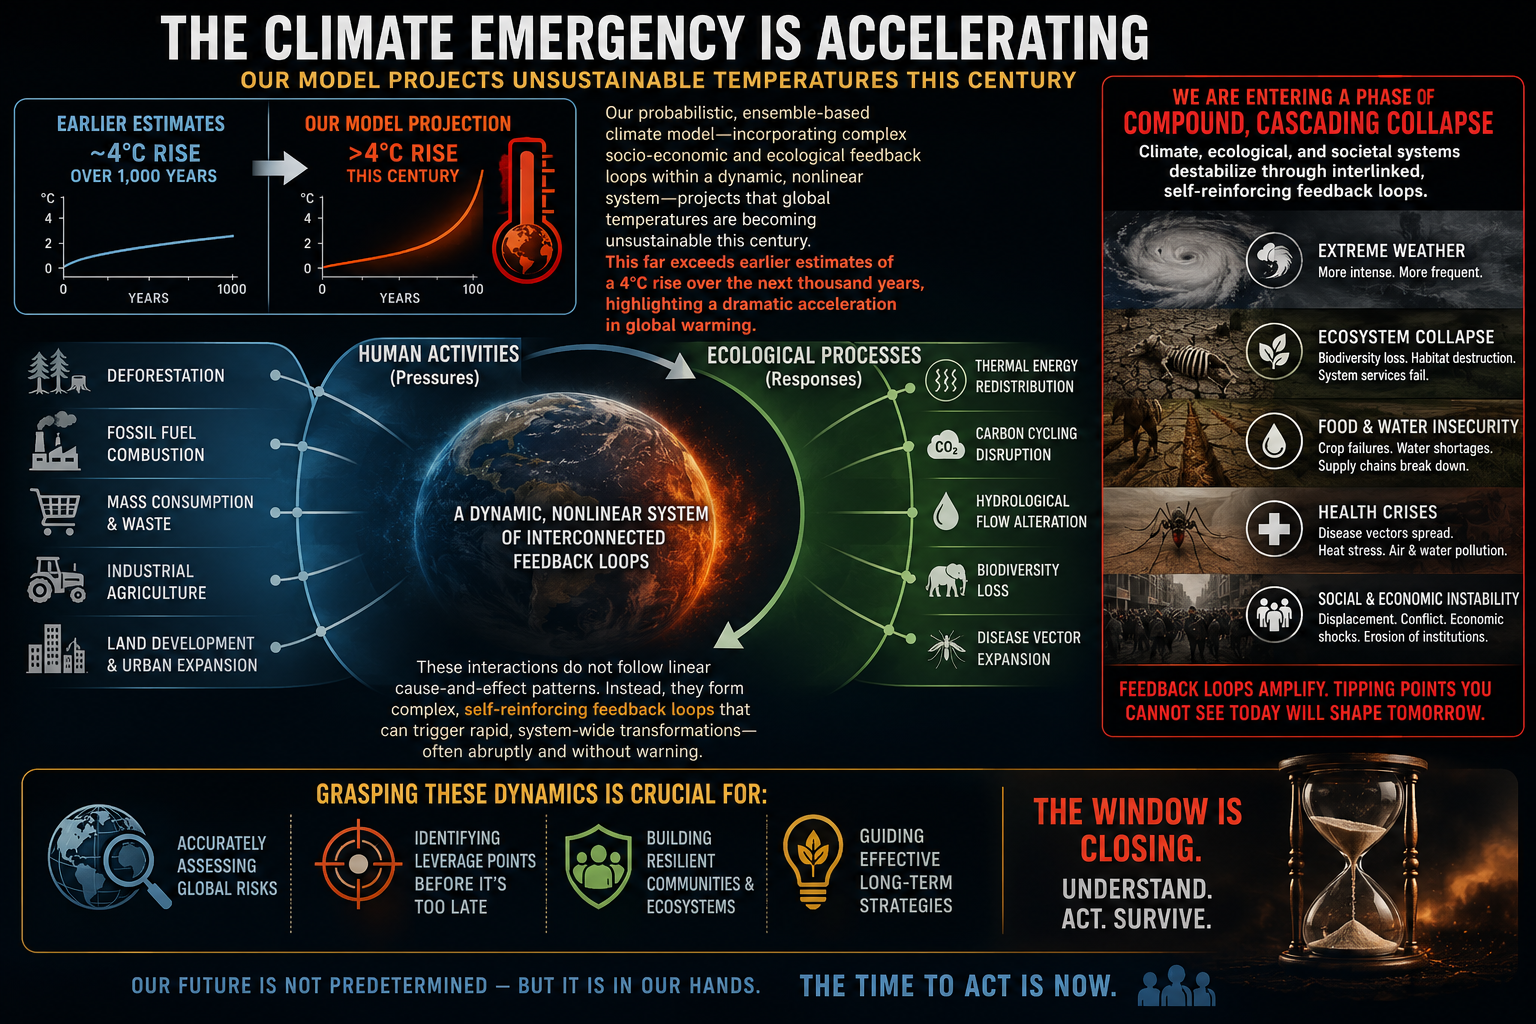
* Our probabilistic, ensemble-based climate model — which incorporates complex socio-economic and ecological feedback loops within a dynamic, nonlinear system — projects that global temperatures are becoming unsustainable this century. This far exceeds earlier estimates of a 4°C rise over the next thousand years, highlighting a dramatic acceleration in global warming. We are now entering a phase of compound, cascading collapse, where climate, ecological, and societal systems destabilize through interlinked, self-reinforcing feedback loops. We examine how human activities — such as deforestation, fossil fuel combustion, mass consumption, industrial agriculture, and land development — interact with ecological processes like thermal energy redistribution, carbon cycling, hydrological flow, biodiversity loss, and the spread of disease vectors. These interactions do not follow linear cause-and-effect patterns. Instead, they form complex, self-reinforcing feedback loops that can trigger rapid, system-wide transformations — often abruptly and without warning. Grasping these dynamics is crucial for accurately assessing global risks and developing effective strategies for long-term survival.
Feedback Loops
→
Tipping Points
→
Feedback Loop and Tipping-Point Network
→
Acceleration
→
Domino Effect
Feedback loops amplify climate change and can push interconnected Earth systems past critical tipping points. As tipping points are crossed, they can trigger additional feedback loops and destabilize other climate systems. This cascading "Domino Effect" compresses timescales, accelerates change, and increases the risk of rapid, nonlinear climate transformations.
Warming → Feedback Activation → Feedback Coupling → Acceleration → Tipping-Point Threshold → Cascade
Ongoing studyIntroduction
The Evolution of Climate Change
CAI(t) = – d/dt [ (1/4) ∑_{i=1}^{4} (ln 2 / k_i(t)) ]
which measures the rate of change of the ensemble-mean doubling time across key Earth system components.
Introduction to the Nonlinear Acceleration Framework
What does that mean?
* or about two orders of magnitude faster system amplification
* the first regime behaves like a slow century-scale doubling process
* the second behaves like a rapidly amplifying nonlinear feedback system with collapsing doubling times.
* Linear or weak-feedback estimates: ~3–5°C
* Strong-feedback scenarios: ~6–9°C (upper-range outcomes under sustained positive feedback participation)
* Long-term high-impact pathways: >10°C over multi-century timescales (often discussed in “Hothouse Earth” framework contexts)
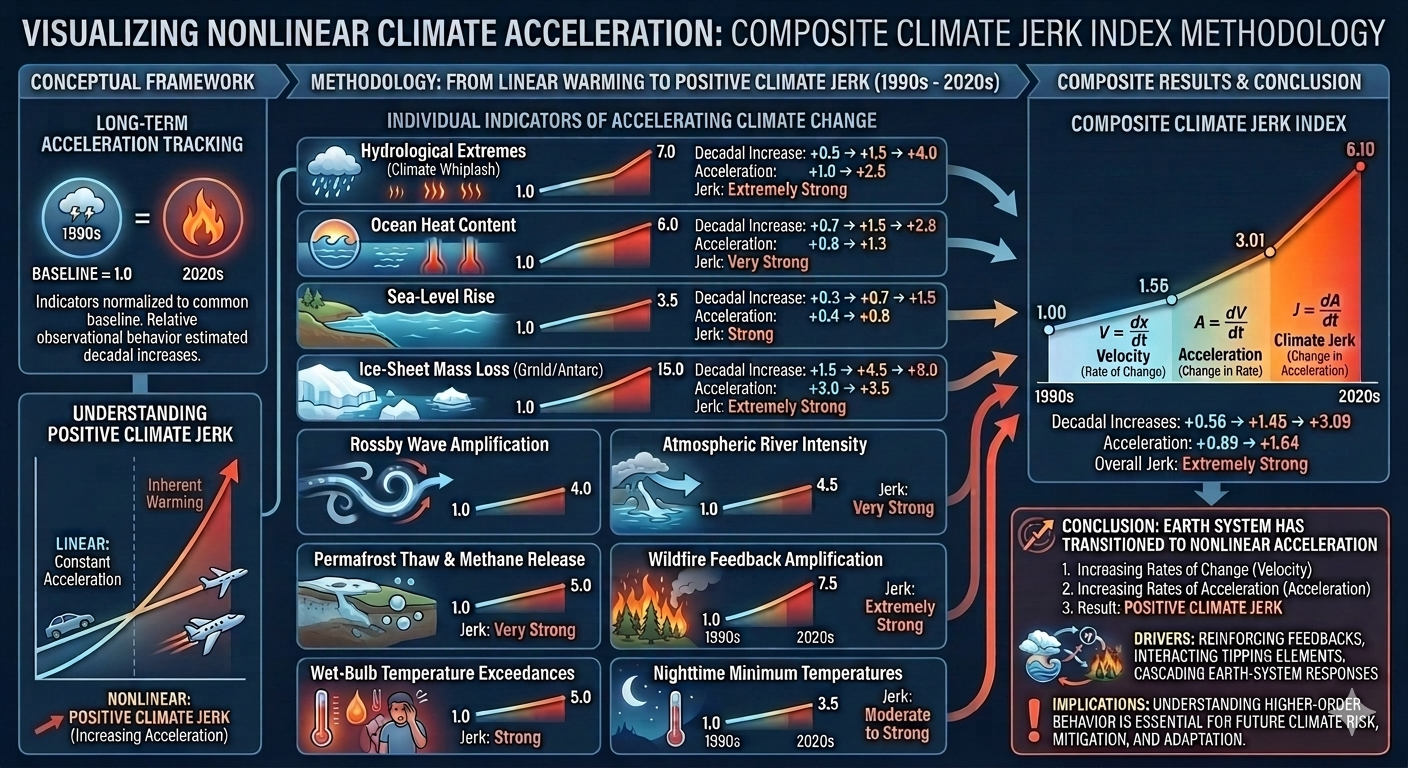
Indicators of Accelerating Climate Acceleration
* Ocean heat content and marine heatwaves
* Greenland and Antarctic ice-sheet dynamic instability
* Sea-level rise doubling times
* Atmospheric river intensity
* Rossby wave amplification and persistence
* Wildfire feedback amplification cycles
* Permafrost thaw and thermokarst collapse
* Methane emissions from wetlands and thawing permafrost
* Atmospheric water-vapor amplification
* Arctic sea ice decline
* Polar amplification
* Wet-bulb temperature exceedances
* Lengthening and increasingly persistent heat waves
* Accelerating increases in nighttime minimum temperatures
* Wildfire frequency and burned area
* Temperature-gradient destabilization
* Moisture-gradient amplification
* Pressure-gradient amplification
* AMOC weakening
* Boreal forest stress and biome migration
* Amazon rainforest dieback
* Zombie fires / overwintering fires
The Nonlinear Acceleration Formula: Doubling Time and Feedback Amplification
Climate Regime Shift: From a Normal Distribution to a Right-Skewed Distribution
A Unified State-Space Framework for Accelerating Earth System Energy Redistribution
CAI(t) = − d/dt [ (1/4) ∑ᵢ₌₁⁴ (ln 2 / kᵢ(t)) ]
Extreme Impacts:
AMOC |
Extreme Weather Events |
Violent Rain |
Deadly Humid Heat |
Sea Level Rise |
Insurance
Ecosystems & Feedbacks:
Ecosystem Collapse & Extinction Risks |
Soil–Insect Climate Feedback Collapse |
Insect Collapse |
Soil |
Trees & Deforestation
Human Health & Society:
Climate Change Business & Economics |
Climate & Human Health |
Limits of Human Adaptability |
Climate-Driven Health Collapse |
Food & Water Security |
Civilization Collapse
Bottom line:
The question is no longer how warm the planet becomes, but how life on Earth can endure when change outpaces our ability to adapt.
We cannot control the laws of physics, but we can control our pollution. The most effective action is to stop burning fossil fuels.