[ The title of this piece is a riff on the book by Prof. David Archer.]
I was tempted into writing this entry upon reading a piece by Mr. de Sousa at the European Tribune site.
especially the sentence
"What is needed now is to bring the debate to the public, dig it out of shady blogs and impenetrable scientific journals."
By way of background, I am a once and sometime physicist. I have plowed through my share of impenetrable journals. So I do feel a certain sympathy for the sentiments expressed by Mr. De Sousa.
That said:
Everyday, I am presented with questions that I cannot fully answer. If these questions are sufficiently important, I educate myself sufficently to form an opinion. If time and circumstance preclude sufficient education, I defer to the opinion of those I consider trustworthy in the matter at hand.
This is dangerous.
If I have not the expertise to form a decision, I naturally tend to agree with a purported expert whose opinion furthers my other interests
Therefore: If the matter is sufficiently important, I bend priorities and arrange circumstance in order to educate myself.
I read James Hansen in the late 80's upon the occasion of his US Senate hearing, but I was then unconvinced of his thesis that humanity was quickly and adversely affecting climate through release of fossil CO2.
I thought to myself, 'The evidence is not compelling enough, yet.'
Besides, I was otherwise occupied at the time.
Ten years later, the impressive modelling of volcanic eruptions, including Pinatubo, and resulting corroboration to Hansen's (and other) models had changed my mind.
At the turn of the millennium, I began my own personal climate education program, which has not yet ended.
From my background I was familiar with the work of Fourier and Arrhenius and there I began. I reworked the Arrhenius calculation, moved on the simple slab atmosphere and ocean models and proceeded to more sophisticated versions,
I soon affirmed that Dr. Hansen was quite correct, and that I had been quite wrong in my initial assessment. A terrible future awaited.
I was unconvinced of Prof. Hansen's case in 1990. The climatologist community went to the labs, collected data, sharpened the questions, provided better answers. By 2001, I was convinced, preponderance of evidence was too weighty for me to deny.
But that was not enough. I had to educate myself in the details I am biased by my background, with the edged gift of mathematical facility. Shirking the calculations was not an option. So, many hours of calculation and programming, all in all quite well worth the effort. I continue these pursuits today.
An example to illustrate my journey:
[Please bear in mind that we do indeed stand on the shoulders of a myriad giants. I will mention a (very) few of the researchers and even fewer of their works. Else, this article would be even longer and more tedious.
Some of the articles mentioned below are quite dense. I do hope I will succeed in illuminating the darker corners. And perhaps persuade some that effort is well expended in learning these complicated matters.
I shall only touch on one very specific issue, that of sea level rise. Other large and looming problems such as the acidification of oceans, or large scale changes in precipitation are ignored in this essay, although I have investigated some of those issues, and I am quite concerned about them ]
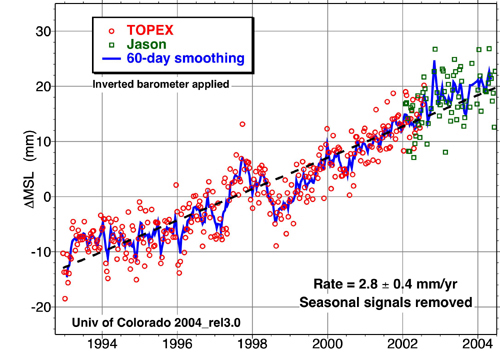
In 2003, a result from the TOPEX satellite data drifted across my screen. Sea level rise as measured by satellite had increased to 2.4 mm/yr. As far as I had been aware, the number had been 1.8 mm/yr for a hundred years, as measured by tide gauges. The early TOPEX data had agreed within the margin of error (2.1 mm/yr +/- 0.4 mm/yr) with the tide gauge results.
My nose twitched, my ears pricked, and every hair stood on end like the quills of the fretful porpentine.
Why did the graph intrigue me so ?
The ocean has far more heat capacity than the atmosphere, and as such, changes much slower than the atmosphere. Any change in the global ocean is years and decades in the making. The ocean is the great integrator. It betrays the amount of heat it stores by sea level rise, for sea water must expand as the temperature rises. And it integrates thermal expansion together with the increase in ocean volume from melting ice on land.
I rarely, if ever, print anything out. But this graph moved me sufficiently, to the point where I printed out a nice colour copy on my girlfriend's printer and affixed it above my desk.
( An example of that graph, together with a rather dated discussion may be found at
http://membrane.com/sidd/sealevel.html) .
When people ask me how a scientist works, I often reply, "I stare at the data till little drops of blood appear on my forehead."
I stared at that graph for the better part of a year.
And I kept reading and calculating.
I obtained the raw datasets and analyzed them. I discovered that the last half of the data exhibited a larger sea level rise than the first. (3.7 mm/yr as opposed to 2.1 mm/yr)
Why would sea level rise have increased ?
I stared at the data some more.
And kept reading and calculating.
Sea level change has several components:
1) Subsidence and rise of underlying sediment and bedrock Previously glaciated continents are still rising in response to removal of ice overburden. Coastal margins sink as human activity or climate change depletes groundwater. Thrust and subsidence of continental plates affect mean sea level. All these affect tide gauge data in particular.
2) Thermal expansion of the ocean as the water warms
3) Melting of continental ice (not floating ice shelves)
4) Impounding freshwater in large dams
5) Depleting terrestrial groundwater as in the Ogallala aquifer, which then returns to the water cycle and the ocean.
The second and third are the principal factors affecting global sea level rise.
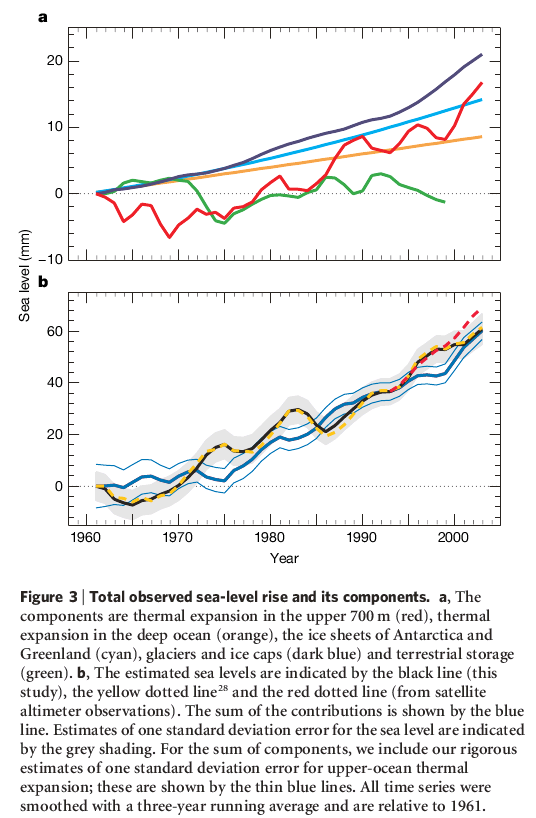
We can estimate thermal expansion from the historical temperature records of the sea surface and the deeps. Levitus and others have measured temperature distributions in the oceans and we can see the warming. From the known thermal expansion coefficient of sea water, we find that the contribution of oceanic heat increase is about 1.6 mm/yr of the total. I do not see how (ie i am not clever enough to think of a way) to greatly increase the amount of heat pumped into the ocean, so in my estimate, this contribution will not increase much in the next decades. In this context geothermal heat contributions,as from undersea vulcanism, are negligible.
Apart from the thermal expansion, continental ice melting is the big factor. Meier and others have untertaken a comprehensive survey and estimate that, excluding Greenland and Antarctica, continental ice (such as in Alaska, South America, the Himalayas) contributes about 1 mm/yr to global sea level rise.
What of Greenland and Antarctica ?
At present the contribution to sea level rise from Greenland is estimated to be about 0.5 mm/yr.
Mass loss estimated from West Antarctica is so far roughly the same as Greenland, and is estimated to cause 0.5 mm/yr sea level rise. This rate is increasing but not nearly as quickly as in Greenland.
If we add up these contributions, we do get roughly the measured sea level increase to within the error estimate.
The following figure from Domingues et al.,Nature, Letters, v453,2008, shows the size of the relative contributions: Note that the values used here for ice mass loss from Greenland and Antarctica do not show the jump we have seen in the last few years after 2003. Of which more later.
I was aware that a characteristic of CO2 induced global warming was a faster warming at the poles. I had been thinking for some time about ice sheet stability or lack thereof.
If the ice on Greenland were to melt completely, the rise in sea level would be about 6 meters. But a complete melt is unlikely. The northern part of the Greenland ice sheet survived the last interglacial period. But even if only the southern part melted, the sea level rise induced would be over two meters.
The great weight of the ice has depressed the rock under it to the extent that the rock surface resembles a bowl with cracked sides.
An animated depiction may be found at
http://membrane.com/sidd/greenrockturn.html
The ice will probably melt in place and the resulting water will drain out into the ocean. One can imagine the glaciers grinding larger openings to the ocean, but that process will not be quick. Nevertheless, the signs are worrying.
As the ice melts,slumps and moves, glacial earthquakes occur. The total number of glacial earthquakes in Greenland has more than doubled between 2002 and 2006.
The ice mass loss from Greenland doubled between 2004 and 2006.
And what of Antarctica ?
As Greenland groans, Antarctica answers.
Some two or three decades ago, a small number of glaciologists including Mercer and Weertman had warned of a possible instability and surge of the West Antarctic glaciers. In 1978, Mercer wrote in the journal Nature : "One warning sign that a dangerous warming is beginning in Antarctica, will be a breakup of ice shelves in the Antarctic Peninsula just south of the recent January 0C isotherm; the ice shelf in the Prince Gustav Channel on the east side of the peninsula, and the Wordie Ice Shelf; the ice shelf in George VI Sound, and the ice shelf in Wilkins Sound on the west side"
Each of these ice shelves is melting or gone today. Payne,Jacobs and many others have measured the effect of warming Circumpolar Deep Water intruding onto the continental shelf and melting the ice shelves from below.
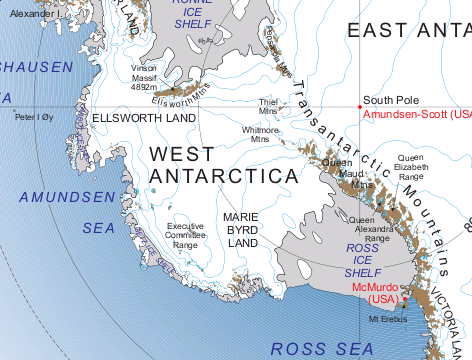
The Antarctic ice sheet is separated into the Eastern and Western sections by the spine of the TransAntarctic mountains. The Eastern section seems stable, except for some sections showing accelerating flow. The Western section is losing mass almost as quickly as Greenland. Here is a map section from http://lima.nasa.gov/antarctica/
The West Antarctic Ice sheet is grounded below sea level and fringed
by great floating ice shelves.The following picture is a map of the
bedrock under the Antarctic ice; the full size version is at
wikipedia: http://upload.wikimedia.org/wikipedia/commons/b/b7/AntarcticBedrock.jpg

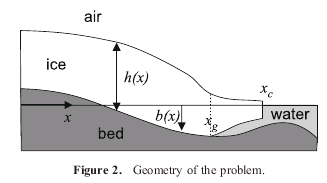
The land below the miles of West Antarctic ice slopes downward as one goes inland. This is an unstable situation even if we were not carbon loading the atmosphere. The following image describes a version of the problem treated by Schoof,Journal of Geophysical Research,v112,F03S28,2007 (This is what some might consider a dense and impenetrable paper.)
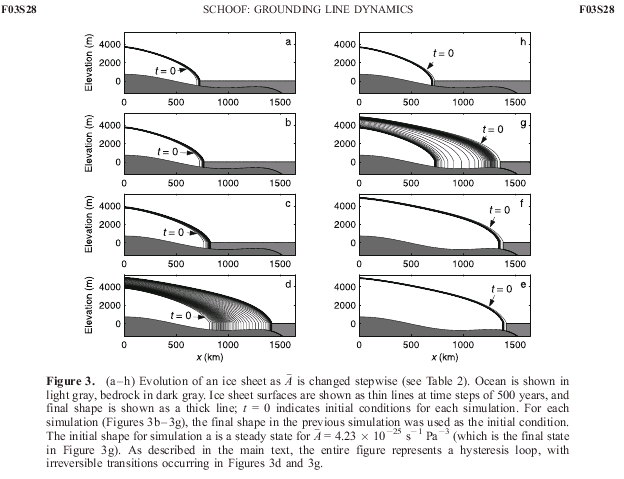
The next figure from the same article shows the instability: we are in Figure 3g. The ice is set to jump back to the position in 3h. The order of the figures is rather odd, the time progression goes down the left hand column,across and up the right hand column. A cooling progression as in an advancing ice age would be the transition from 3c to 3d.
The ice shelves in West Antarctica are breaking up. As Greenland melts, sea level rises, these shelves float freer and break faster. The ice shelves restrain the ice behind from flowing unimpeded into the ocean.
Unlike Greenland, where the glaciers reach the sea through narrow channels, in the West Antarctic behind the Pine Island (PIG) or the Thwaites Glacier (THW) one would have a plain of ice fifty or a hundred kilometers wide all moving to the ocean. That would be a horrifying glacial surge indeed. And only one of many.
The following figure is from Holt et al., Geophysical Research Letters, v33, L09502, 2006.
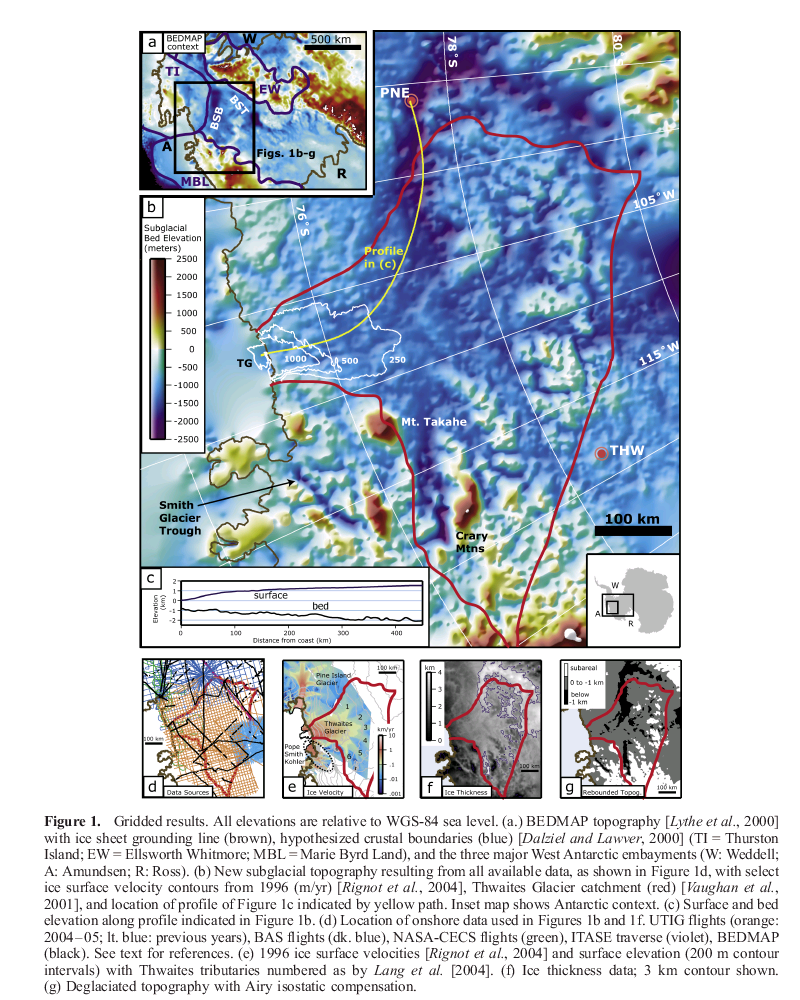
The Thwaites glacier has a bed that not only slopes downward inland, the glacier is also expected to widen as the grounding line retreats. Below its inner reaches lies the Byrd Subpolar Basin, indicated by 'BSB' in the figure above. So as it melts back, more of it will be exposed to the warming ocean.
Below the ice, the ocean works a million little warming tentacles down the submarine slopes, into the great Byrd Subpolar Basin.
Recall the instability shown in the Schoof graph above. Now consider an application of the Schoof treatment to the West Antarctic Ice sheet. The distance between ice grounding lines in 3g and 3h in this case is on the order of thousands of kilometers. The ice facing the Amundsen Sea now (3g in Schoof) retreats all the way to the Transantarctic mountains (Fig 3h) taking the shelves and glaciers feeding the Ross Sea with it. That would be a fearsome instantiation of the Fig 3g to 3h transition and would result in sea level rise of several meters.
How long ?
Back to the satellite sea level rise data. The sea level rise today is (depending on the period chosen) about 4.0 mm/yr The graph below is an updated version of the first graph from a presentation by Abdalati entitled "Ice Sheets, Glaciers and Rising Seas"
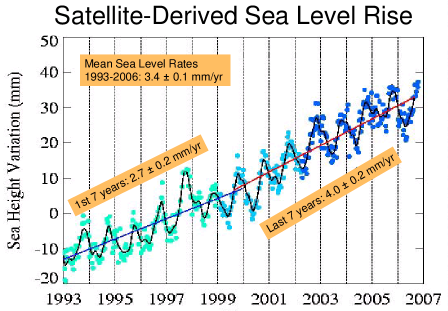
The data indicate a doubling of sea level rise in a decade.
So in 2020 we might expect sea level rise of a centimeter a year. [Edit 2022: I was wrong, we are at a third of that, but accelerating. https://climate.nasa.gov/vital-signs/sea-level/ ]
Humans live near the coast, and most of them do not live on cliffs. The average beach gradient is 1 in a 100 or less. Therefore 1 cm. sea level rise will result in coastline retreat of 1 meter.
Every year.
And once we have destabilized these ice sheets, there will be no stable coastline for centuries.
I repeat: There will be no stable coastline for centuries
How bad ?
Hansen likes to point to a a great flood called Melt Water Pulse 1 A, some fourteen thousand years ago, when the ocean rose by a meter every twenty years. For five hundred years in a row.
Yes, it could get that bad.
So what is to be done ?
Don't look at me. I'm just some random guy writing on a web site. The best thing to do is learn more. Read the primary literature. A good place to go is realclimate or The Discovery of Global Warming
For what it's worth, this is what I am doing.
First, I apologize to the children.
Next, cut my CO2 footprint.
And I keep trying to learn more, everyday.
Wish me luck. I wish you the same.
We will all need it, especially the little ones.
"Surely every medicine is an innovation; and he that will not apply new remedies, must expect new evils; for time is the greatest innovator; and if time of course alter things to the worse, and wisdom and counsel shall not alter them to the better, what shall be the end?"
Francis Bacon.