One Planet. One Water Cycle. Endless Consequences.
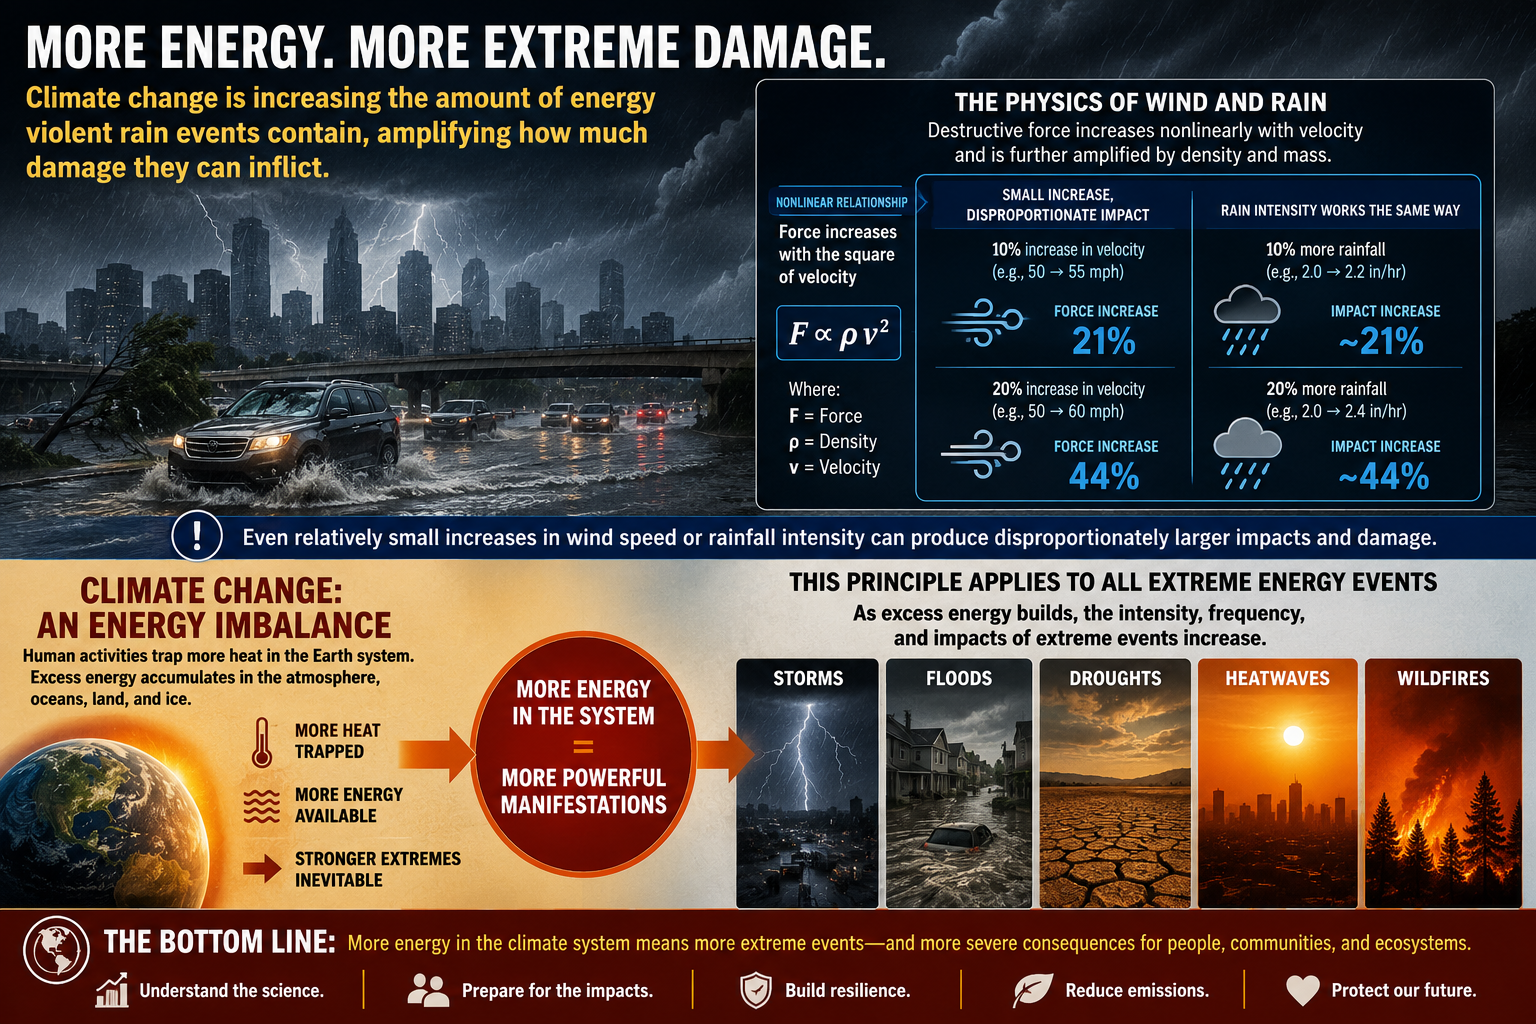
"Climate change is increasing the amount of energy violent rain events contain, amplifying how much damage they can inflict."
The physics of wind and rain are important to understand: their destructive force increases nonlinearly with velocity and is further amplified by density and mass. Even relatively small increases in wind speed or rainfall intensity can produce disproportionately larger impacts and damage.
This principle applies to all extreme energy events. At its core, climate change is an energy imbalance. As excess heat accumulates within the Earth system, more energy becomes available to drive storms, floods, droughts, heatwaves, and wildfires. As the energy intensifies, so do its manifestations.
Introduction
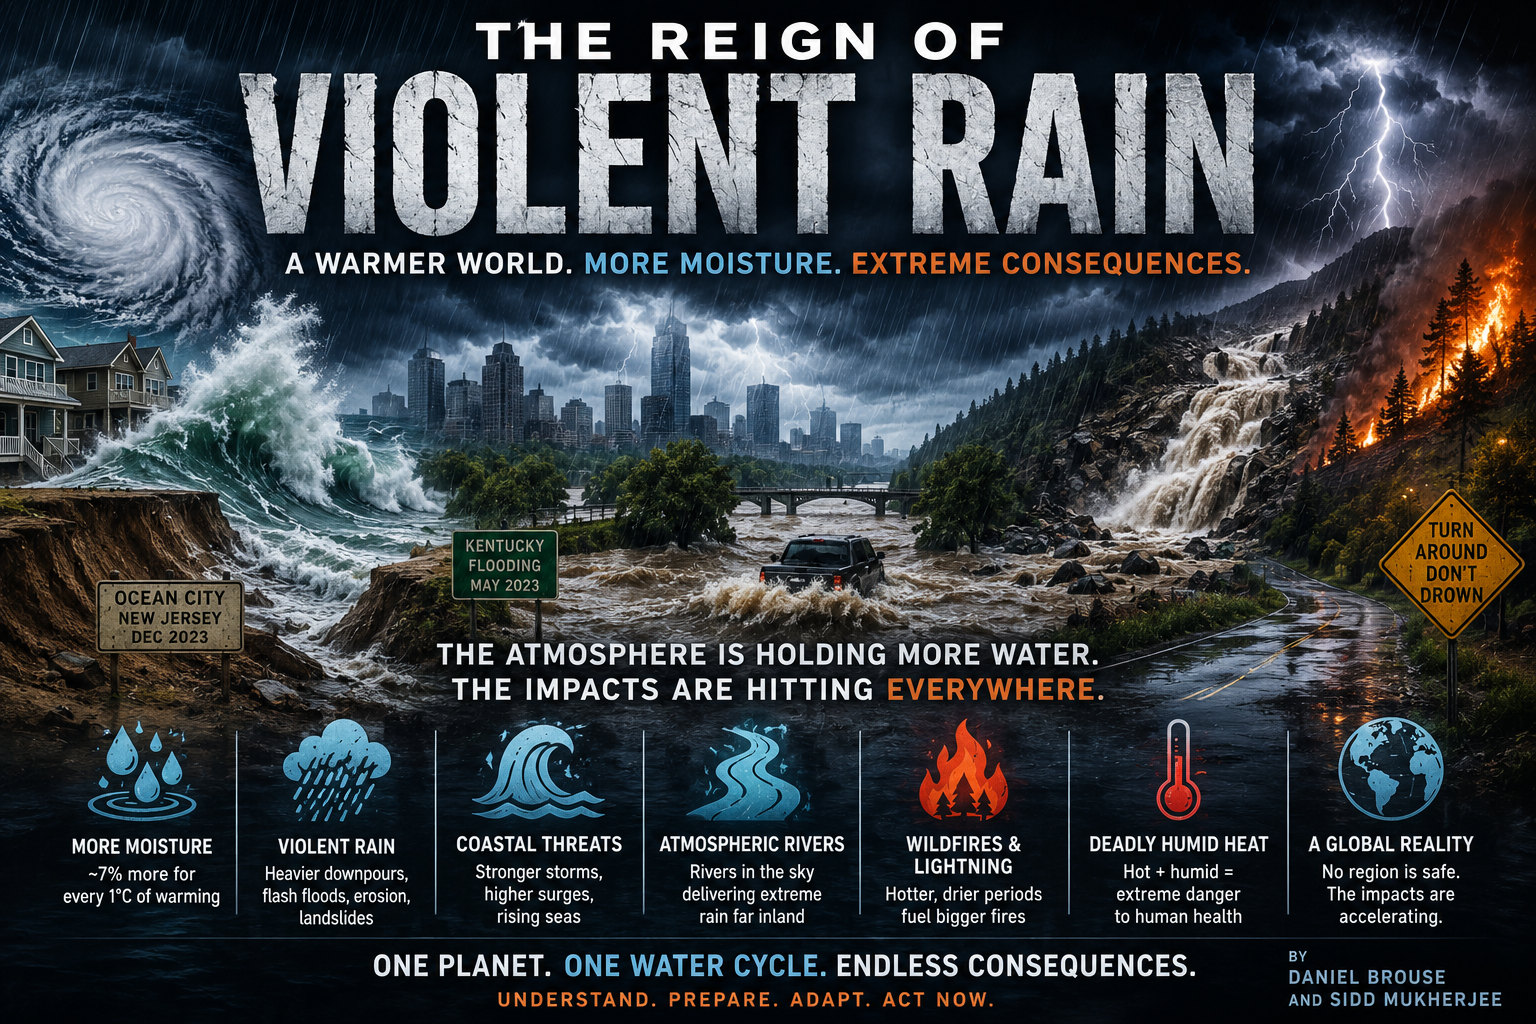
The Reign of Violent Rain
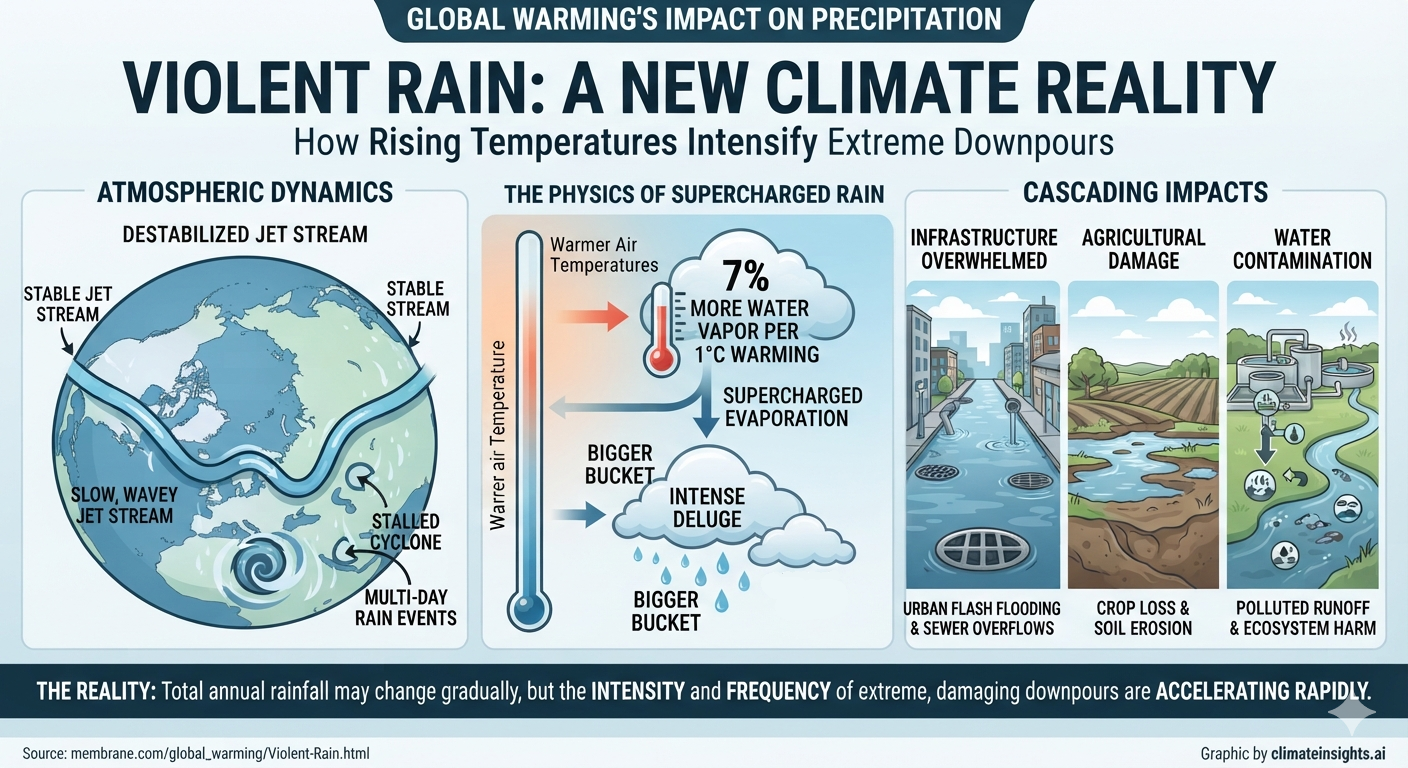
Violent rain events are the definitive new climate reality, as rising global temperatures directly alter how, when, and where water falls. Across the world, scientists report that while total annual precipitation may change gradually, the intensity and frequency of extreme downpours are accelerating rapidly. This shift is transforming gentle, localized rain into destructive, high-volume torrents capable of overwhelming modern infrastructure in minutes.
Hydroclimatic whiplash is rapidly shifting regions between drought and deluge, while atmospheric rivers are transporting unprecedented amounts of moisture deep into continental interiors.
Violent Rain Damage
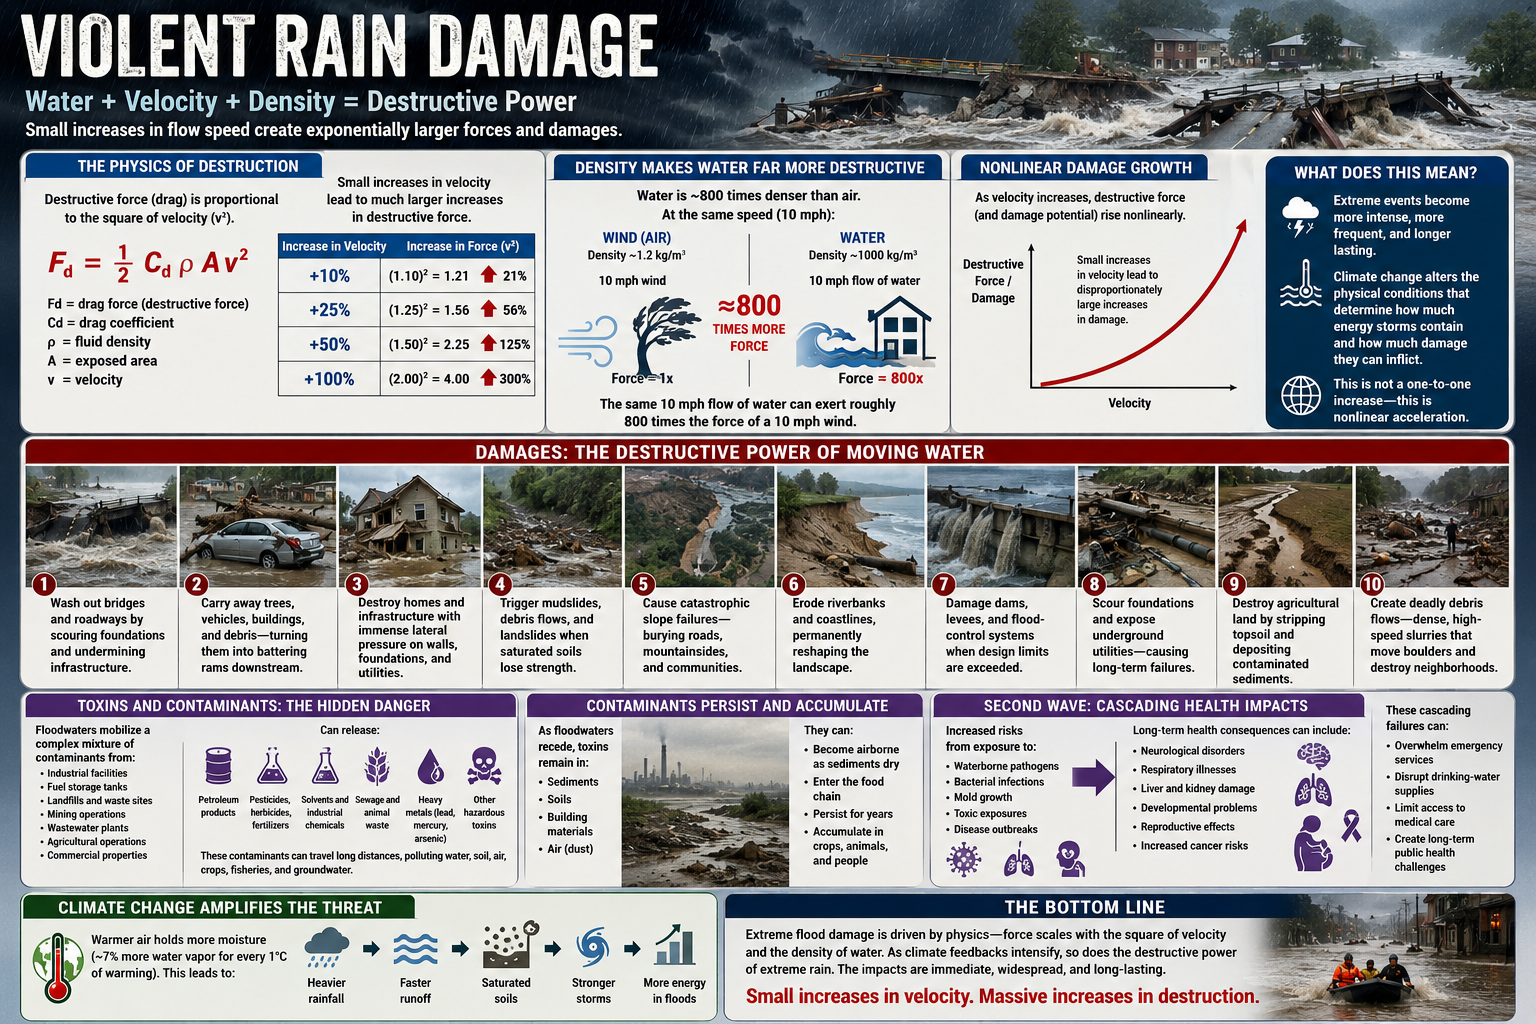
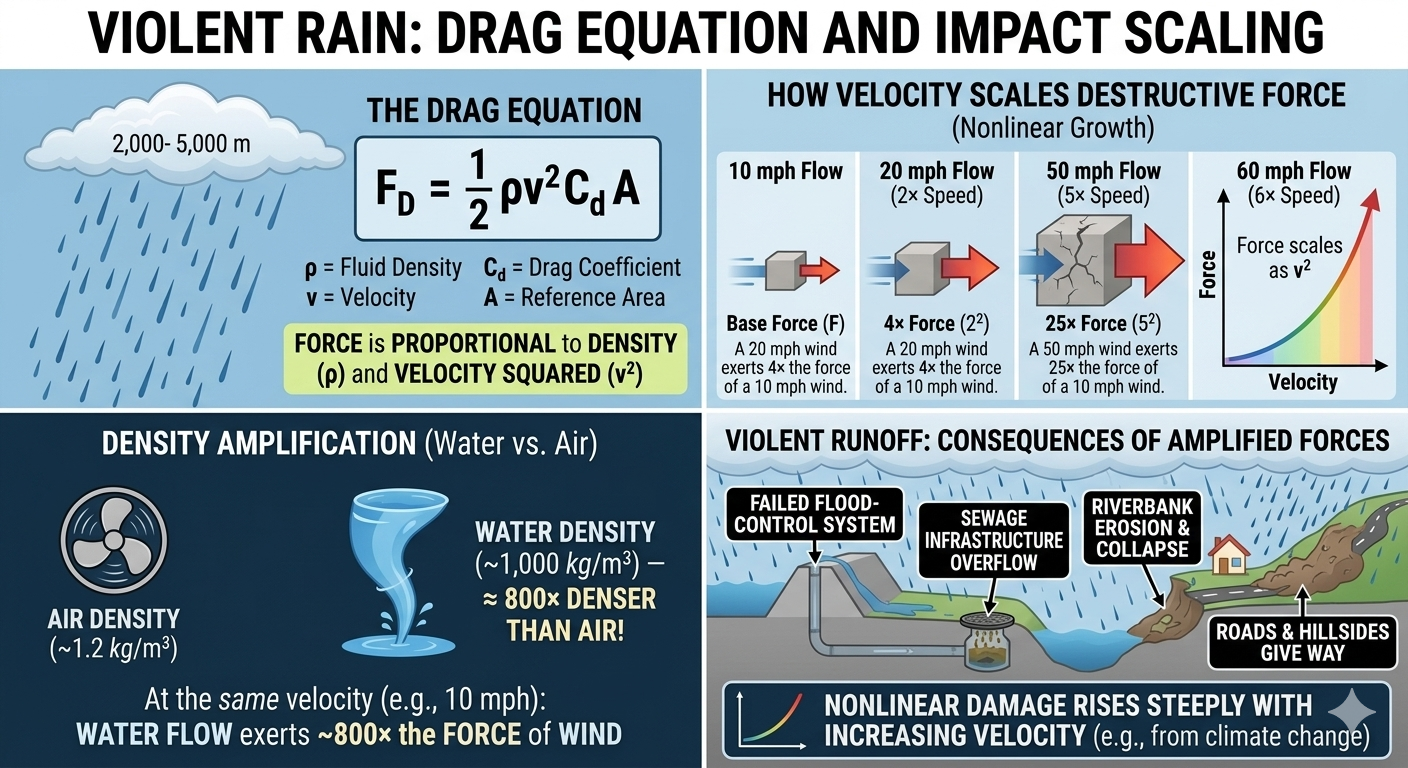
The destructive power of both wind and water scales approximately with the square of velocity (v²), meaning relatively small increases in flow speed can lead to disproportionately large increases in force and damage. Density further amplifies these impacts. Because water is approximately 800 times denser than air, a 10 mph flow of water can exert roughly 800 times the force of a 10 mph wind at the same speed. As climate change increases flow velocities, the resulting forces and damages rise nonlinearly.
What does this mean?
The physics of extreme events is nonlinear. Wind and water damage do not increase in a simple one-to-one relationship with climate change because destructive force scales with the square of velocity. As climate feedbacks become increasingly coupled, extreme events can become more intense, more frequent, and longer lasting. Climate change is not simply producing more storms or heavier rainfall; it is altering the physical conditions that determine their intensity, duration, and destructive potential.
Climate change is increasing the amount of energy violent rain events contain, amplifying how much damage they can inflict.
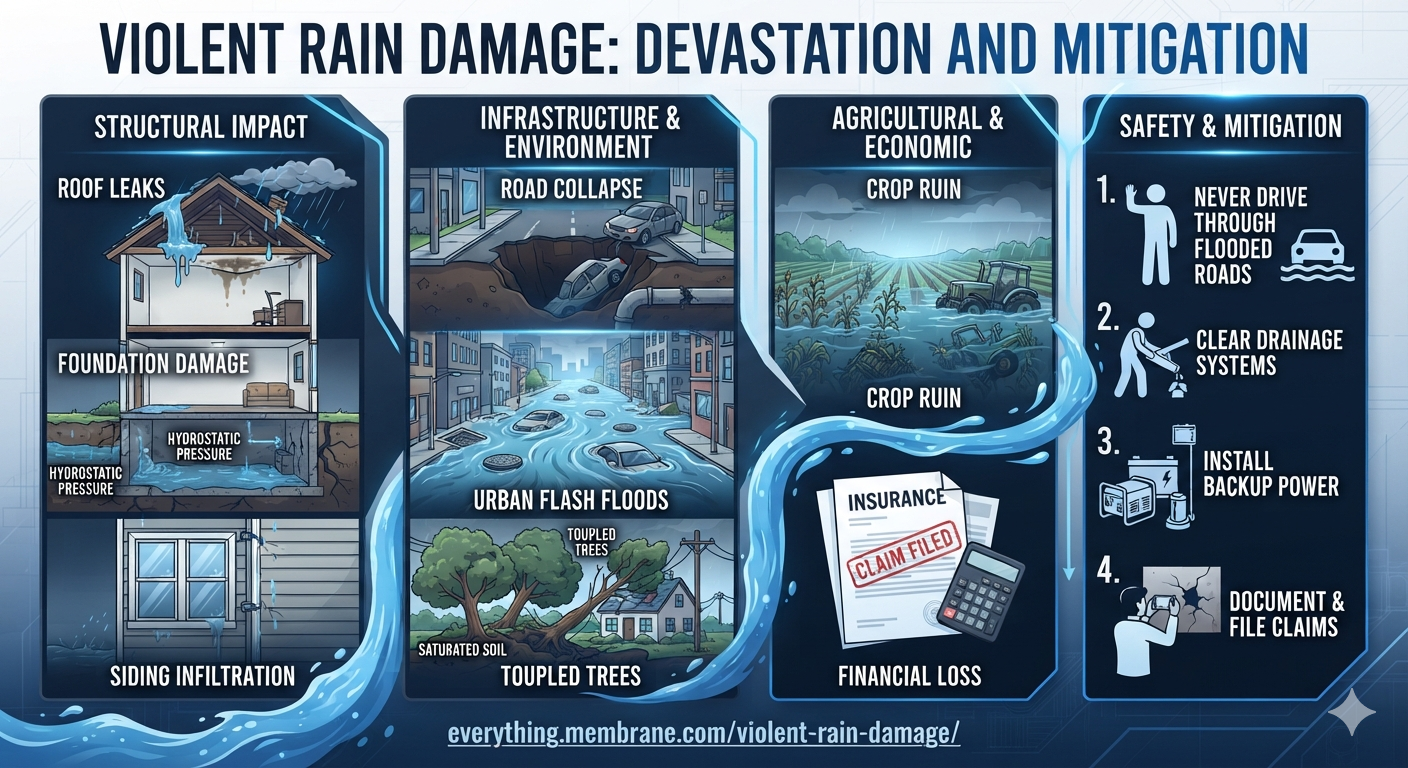
Damages — The destructive power of moving water is evident in countless real-world examples. Floodwaters do not simply rise; they become a powerful moving force capable of transporting enormous amounts of mass and energy. Fast-moving water can:
The destructive power of both wind and water scales approximately with the square of velocity (v²).
Wash out bridges and roadways by scouring away foundations, eroding support structures, and undermining concrete, asphalt, and other infrastructure.
Carry away trees, vehicles, buildings, and debris, turning ordinary objects into battering rams that multiply destruction downstream.
Destroy homes and infrastructure as flood currents exert immense lateral pressure on walls, foundations, electrical systems, and utilities.
Trigger mudslides, debris flows, and landslides when saturated soils lose strength and entire hillsides collapse under the weight of water.
Cause catastrophic slope failures, where mountainsides, roads, and communities can be buried beneath rapidly moving earth, rock, and water.
Erode riverbanks and coastlines, permanently reshaping landscapes and removing natural protective barriers.
Damage dams, levees, and flood-control systems when water volumes and flow rates exceed engineering design limits.
Scour foundations and expose underground utilities, causing structural failures that can continue long after floodwaters recede.
Destroy agricultural land by stripping away fertile topsoil, depositing contaminated sediments, and altering drainage patterns.
Create deadly debris flows where water, soil, rocks, trees, and other materials combine into a dense, high-speed slurry capable of moving massive boulders and destroying entire neighborhoods.
The danger of extreme flooding is not only the amount of water involved, but the velocity and density of that water. Because water is hundreds of times denser than air, even relatively slow-moving floodwaters can generate forces capable of moving vehicles, uprooting trees, collapsing structures, and reshaping entire landscapes.
The aftermath of extreme flooding can create a second wave of destruction through cascading health impacts. When water treatment facilities fail, sewage systems overflow, and agricultural waste contaminates floodwaters, communities face increased risks from waterborne pathogens, bacterial infections, mold growth, toxic exposures, and disease outbreaks.
Violent rain damages and aftermath.
Floodwaters can also mobilize a complex mixture of chemical contaminants. Industrial facilities, warehouses, fuel storage tanks, landfills, mining sites, wastewater plants, and commercial properties may release petroleum products, pesticides, herbicides, fertilizers, solvents, heavy metals such as lead, mercury, and arsenic, and other hazardous chemicals into surrounding communities. Floodwaters can transport these contaminants over long distances, depositing them into homes, schools, agricultural fields, rivers, lakes, wetlands, and groundwater supplies.
As floodwaters recede, many contaminants remain behind in sediments, soils, and building materials. Some chemicals can become airborne as contaminated sediments dry, exposing people through inhalation as well as direct contact and ingestion. Certain toxins can persist in the environment for years, accumulate in food chains, contaminate crops and fisheries, and produce long-term ecological and human health consequences, including neurological disorders, respiratory illnesses, liver and kidney damage, developmental problems, reproductive effects, and increased cancer risks.
These cascading failures can overwhelm emergency services, disrupt drinking-water supplies, limit access to medical care, and create long-term public health challenges. The damage is therefore not limited to the immediate destruction caused by floodwaters; it can trigger a chain reaction affecting ecosystems, infrastructure, food systems, economies, and human health for months, years, or even decades afterward.
As climate change increases atmospheric moisture, rainfall intensity, and the frequency of extreme precipitation events, the energy carried by floodwaters increases nonlinearly. A modest increase in rainfall can produce a much larger increase in destructive force when combined with faster runoff, saturated soils, and stronger storm systems.
The Greatest Threats of Climate Change Have Become Reality
Infectious disease vectors,
violent rain, and
deadly humid heat
now stand among the greatest threats of climate change, no longer future
warnings but present realities. This deadly triad—rising infectious
diseases, escalating heat extremes, and increasingly intense rainfall
events—has begun driving an exponential increase in climate-related
deaths worldwide. These hazards do not operate in isolation; they amplify
one another's impacts, creating cascading risks that strain health systems,
destabilize communities, damage economies, and accelerate global mortality.
Climate change has become a full-scale health and societal crisis,
demanding urgent, systemic action before these accelerating threats
overwhelm society's ability to respond.
Violent Rain: A New Climate Reality
My interest in
sea-level rise and collapsing ice sheets
began in the 1990s after I asked Sidd about his greatest concerns
regarding human-induced climate change. Much of climate change can still
be mitigated, slowed, or prevented from worsening. The collapse of major
ice sheets, however, is largely irreversible on human timescales.
Sidd's response was sobering: A terrible future awaited.
At the time, coastal areas were forecast to face the greatest risks.
By 2020, I had become just as concerned about the consequences of rising
ocean temperatures and sea-level rise being transported inland through the
atmosphere. Both ocean and air temperatures are rising. Warm air can
physically hold more moisture than cool air, and warmer oceans produce
more evaporation. This additional atmospheric moisture is carried over
land, fueling increasingly intense inland deluges and catastrophic
flooding events far from the coast.
Now I am thinking the violent rain will be a bigger
problem before we die... still thinking it through. In the long run,
ya, sea level rise will hit big. If you look at the history, it is
episodic, and in
the fast bits it can go up 3 feet every twenty years for five hundred years
.
But, the rain intensity is increasing faster today, and drainage cannot
cope, whether in the city or out. Culverts and such put in over the
last hundred years cannot handle it. So, I am paying a lot of attention
to terrain and drainage far inland from the seacoast (like Ohio.) By
drainage I don't mean just human built. I mean that the natural streams,
gullies, and ravines have not evolved to a state that can handle the
water volumes we see and the even larger volumes we will see. So expect
greater erosion, steeper slopes to waterways, land collapses, and
similar impacts. Build out your drainage.
- Sidd Mukherjee
What Is Violent Rain?
The Reign of Violent Rain
Many people equate global warming solely with increasing
temperatures. This is a deadly misunderstanding. The additional energy
accumulating within Earth's climate system does not remain simply as heat.
It is redistributed throughout the atmosphere and oceans, manifesting in
many forms of extreme weather, including floods, stronger storms,
atmospheric rivers, and increasingly destructive episodes of
violent rain.
Violent rain is not merely heavier rainfall. It is rainfall intensified by
the additional energy and moisture now present in the climate system,
producing larger raindrops, higher rainfall rates, more intense runoff,
and more destructive flooding and erosion.
As the Earth warms, warmer air can physically hold more
water vapor than cooler air. For every 1°C (1.8°F)
increase in temperature, the atmosphere can hold approximately
7% more moisture, increasing the potential for extreme
precipitation. Over a 10°C increase, atmospheric
moisture capacity nearly doubles, dramatically
amplifying the intensity and frequency of heavy rainfall events.
One physical consequence of warming is the formation of larger raindrops,
along with an increase in the number of raindrops falling per square foot.
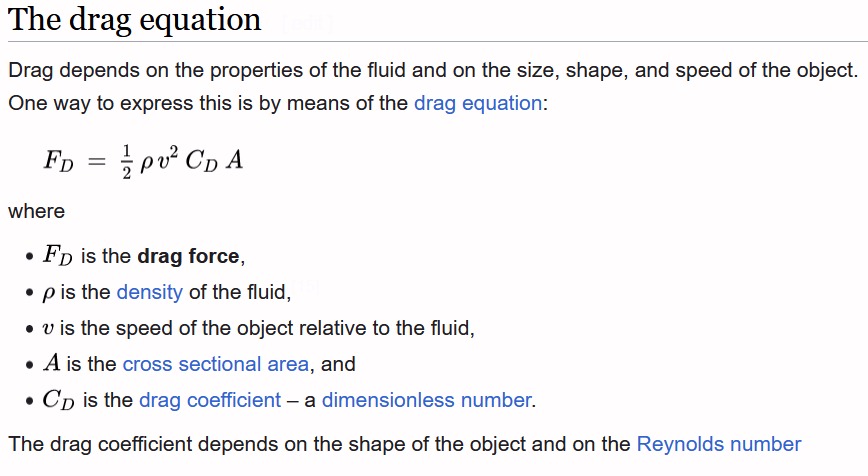
Momentum of Rain
is defined by the equation:
Violent Rain: The Force of Drag Physic
p = mv
As raindrop mass increases, so does momentum. Part of this increasing
momentum transfers to the surrounding air, contributing to greater
turbulence, downdrafts, and localized wind variability. Most of the
momentum, however, is transferred upon impact. This effect can often be
observed as rain splashes higher off roads and sidewalks during intense
downpours. Flowing rainwater also carries greater mass and velocity,
increasing the destructive power of runoff and floodwaters.
On the ground, concrete, asphalt, solar panels, roofs, vegetation,
wildlife, homes, and infrastructure are all struck with greater force as
rain momentum rises. Every additional increment of atmospheric moisture
translates into greater kinetic energy being transferred to both natural
and human systems.
Mass and velocity are part of a larger equation that also includes
density. Together, these variables determine the
intensity of flow forces and fluid dynamics. Both wind
and water forces scale approximately with the square of velocity
(v²). Consequently, relatively small increases in
flow speed can produce disproportionately large increases in destructive
force.
According to drag physics, force is proportional to
density multiplied by the square of velocity
(v²). For example:
A 20 mph wind exerts 4 times the force of a 10 mph wind.
A 40 mph wind exerts 16 times the force of a 10 mph wind.
A 50 mph wind exerts 25 times the force of a 10 mph wind.
A 60 mph wind exerts 36 times the force of a 10 mph wind.
Density further amplifies these forces. Water is approximately
800 times denser than air, meaning a 10 mph flow of
water can exert roughly 800 times the force of a 10 mph wind.
As flow velocities increase due to climate change, the resulting forces
and damages rise nonlinearly and can appear exponential in their impacts.
Although the precise rate at which climate change alters flow velocities
remains an active area of research, the consequences are already visible
worldwide as flood-control systems fail, sewage infrastructure overflows,
riverbanks erode, roads collapse, and hillsides give way under the
amplified force of violent rain and runoff.
In just ten days during July 2025, hundreds of flash floods swept across
the United States, inundating communities from coast to coast, killing
hundreds of people and causing billions of dollars in damage. At least
five 1-in-1,000-year rainfall events struck Texas, New Mexico,
North Carolina, Florida, and Illinois. Meanwhile, Pennsylvania, Delaware,
New Jersey, Maryland, Virginia, and Iowa reported multiple
500-year floods as extreme rainfall overwhelmed infrastructure
across much of the country.
These events illustrate a rapidly emerging reality:
violent rain is no longer an anomaly. It is becoming one of the defining
hazards of a warming planet.
Hydroclimatic Whiplash
Hydroclimatic whiplash is the rapid, often violent transition between extremely wet conditions and dangerously dry droughts. Driven primarily by human-caused climate change, this phenomenon is accelerating globally because a warming atmosphere behaves like an expanding atmospheric sponge, capable of absorbing, transporting, and releasing increasingly large amounts of water.
Key Drivers and Mechanisms
The Atmospheric Sponge Effect:
As air temperatures rise, the atmosphere can hold substantially more water vapor. This increases both
evaporative demand—the atmosphere's ability to pull moisture from soils, vegetation, and water bodies—and the potential intensity of precipitation when that moisture is eventually released.
Thermodynamic Scaling:
The Clausius-Clapeyron relationship indicates that the atmosphere can hold approximately
7% more moisture for every 1°C (1.8°F) of warming. This increase compounds the intensity of both droughts and rainfall events, making transitions between them increasingly abrupt and severe.
Subseasonal Volatility:
Peer-reviewed research published in Nature shows that global subseasonal hydroclimatic whiplash events have increased by approximately
31% to 66% since the mid-20th century, demonstrating that rapid swings between hydrological extremes are becoming significantly more common.
Compounding Real-World Impacts
The "Boom-and-Bust" Fire Cycle:
As observed in California and other regions, exceptionally wet periods promote rapid and extensive vegetation growth. When weather patterns suddenly shift to record heat and severe drought, that vegetation dries into highly combustible fuel, setting the stage for larger, faster-moving, and more destructive wildfires.
River and Flash Flooding:
When torrential rain falls on drought-stricken, hardened, or hydrophobic soils, much of the water cannot infiltrate the ground. Instead, runoff accelerates, increasing river whiplash, degrading water quality, eroding landscapes, and producing dangerous flash floods.
Water Management Crises:
Traditional water infrastructure and forecasting systems were designed using historical climate patterns that assumed relatively stable conditions. Hydroclimatic whiplash increasingly renders these assumptions obsolete, as reservoirs, rivers, and watersheds can transition from drought conditions to flooding in a matter of weeks, overwhelming water management strategies and infrastructure.
Hydroclimatic whiplash illustrates a fundamental reality of climate change: global warming does not simply make the world hotter. It injects additional energy and moisture into the Earth system, increasing the volatility of the hydrological cycle and driving more extreme swings between drought and deluge.
"Tropical cyclones (TCs) are drivers of extreme rainfall and surge, but the current and future TC rainfall-surge joint hazard has not been well quantified. Using a physics-based approach to simulate TC rainfall and storm tides, we show drastic increases in the joint hazard from historical to projected future (SSP5-8.5) conditions. The frequency of joint extreme events (exceeding both hazards' historical 100-year levels) may increase by 7-36-fold in the southern US and 30-195-fold in the Northeast by 2100."
The study concluded that these increases are driven by both sea-level rise and changes in tropical cyclone climatology. For approximately 96% of the U.S. coastline, changes in tropical cyclones contribute more to the increased hazard than sea-level rise alone, largely because warmer oceans and a warmer atmosphere are producing greater rainfall rates. Increasing storm intensity and slower storm movement further amplify both rainfall and storm tides while increasing their interdependence.
As the climate system continues to warm, expect increasing intensity and, in many regions, increasing frequency of a wide variety of violent rain events, including:
Compound and concurrent extremes involving multiple hazards occurring simultaneously
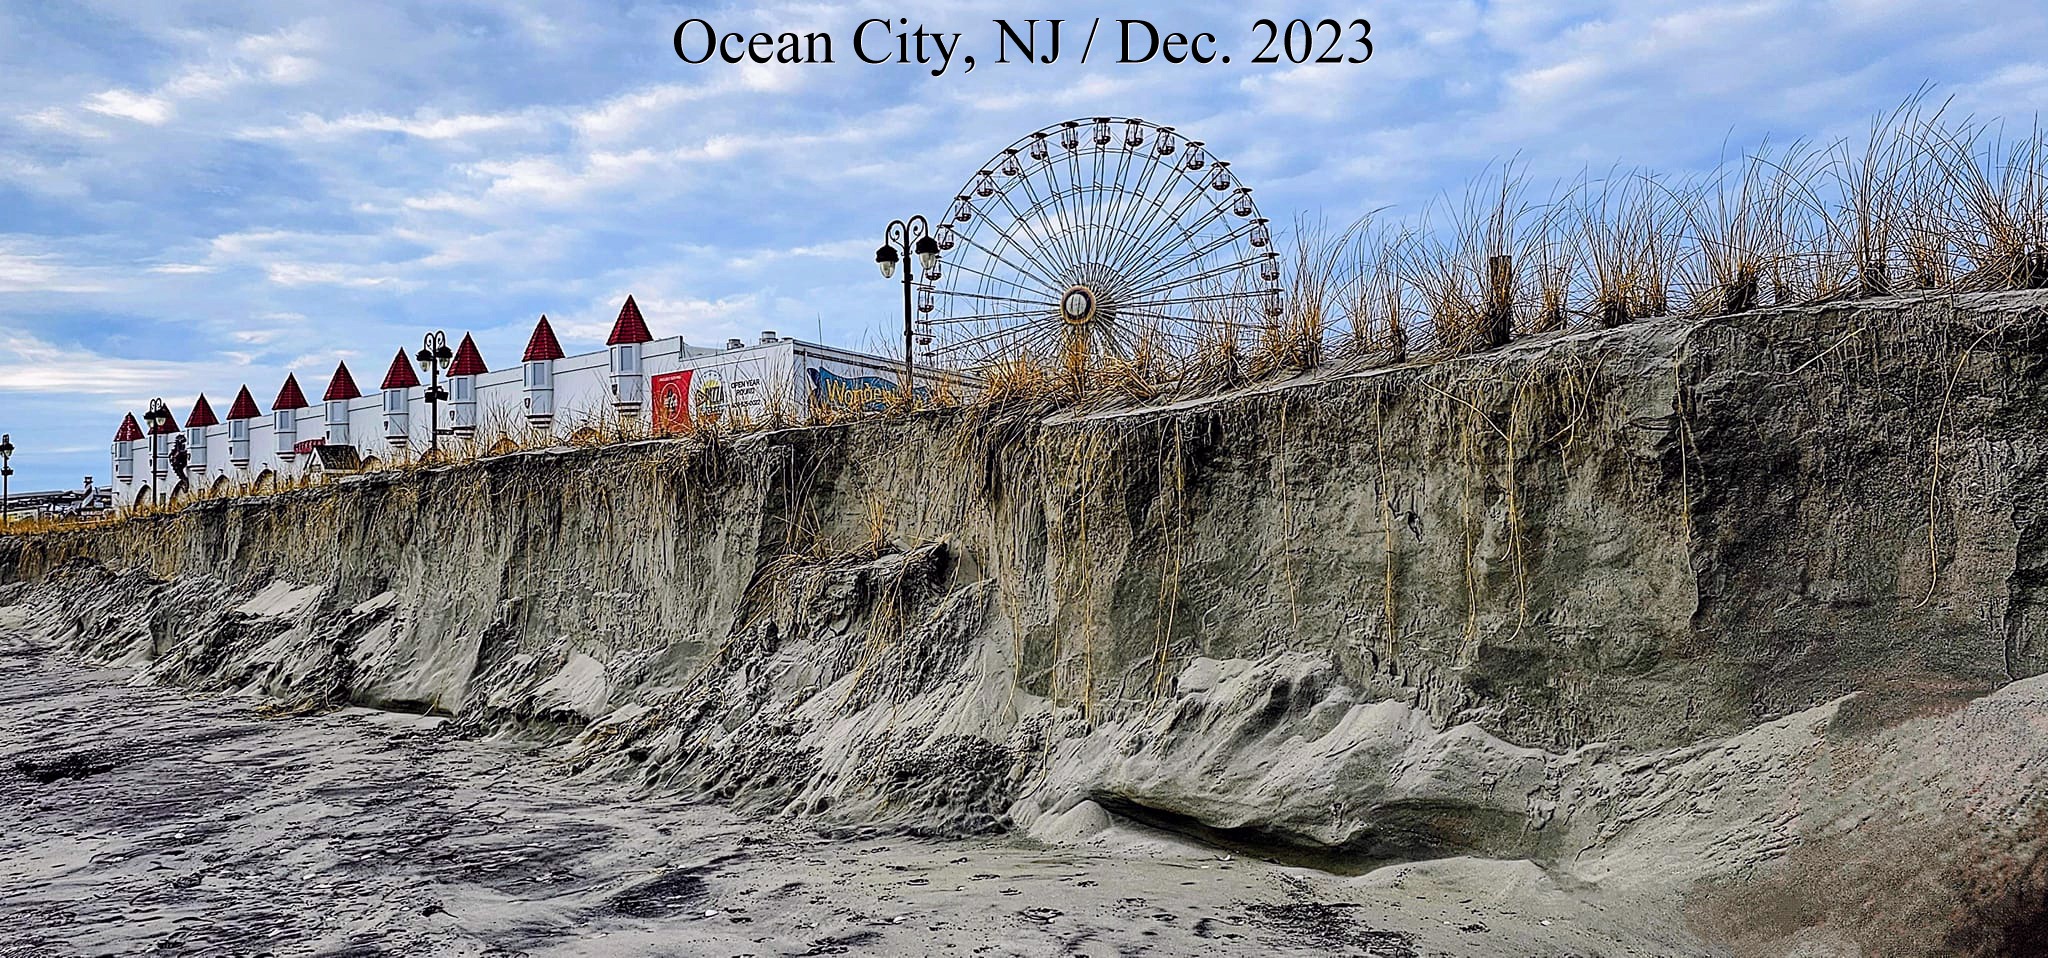
The reign of violent rain has already begun. Around the world, hillsides and shorelines are increasingly collapsing under the amplified force of water. Atmospheric rivers are dramatically increasing flash flooding across the Northeastern United States, including severe beach erosion in Ocean City, New Jersey, in December 2023.
Beach erosion in Ocean City, New Jersey, December 2023.
Worldwide, stormwater systems are increasingly being overwhelmed. Ironically, the streets of Abu Dhabi and Dubai in the United Arab Emirates flooded just days before the COP28 Climate Conference. Nowhere is entirely insulated from violent rain—not even a desert city preparing to host a United Nations climate conference.
As episodes of violent rain intensify, new drainage channels and culverts are forming in places where they previously did not exist. Over time, some of these channels may become recurring streams, carving new ravines and canyons and gradually reshaping landscapes, shorelines, and even islands. In addition, increasing climate extremes are contributing to more frequent lightning storms and larger wildfires. Following major wildfires, intense rainfall often triggers destructive debris flows and landslides that permanently alter local topography.
At the same time that violent rain is making its way toward the sea, the sea is rising to meet the violent rain.
You can imagine eastern and western North America as vast coastlines facing increasingly frequent atmospheric waves of heat, moisture, and storm energy crashing upon the continent. The Gulf Coast, in particular, faces converging threats from both directions—rising seas moving inland and increasingly intense atmospheric rivers and tropical systems moving ashore.
Atmospheric Rivers
As the Earth warms, the atmosphere can hold substantially more moisture. Warmer oceans also increase evaporation, loading the atmosphere with additional water vapor. This moisture is increasingly being transported over land in long, narrow corridors known as atmospheric rivers (ARs), sometimes called rivers in the sky. Well-known examples include the Pineapple Express, which transports tropical Pacific moisture to western North America.
The journal EOS, in the article
Atmospheric Rivers Spur High-Tide Floods on U.S. West Coast,
describes atmospheric rivers as narrow bands of concentrated water vapor that travel through the lower troposphere, typically along the leading edges of major low-pressure systems. At peak intensity, atmospheric rivers can transport amounts of water vapor comparable to or even exceeding the flow of the Amazon River. As they make landfall, they unleash intense winds, heavy precipitation, flooding, and coastal impacts.
Atmospheric rivers do not simply affect coastlines. They frequently transport enormous amounts of moisture hundreds or even thousands of miles inland, producing extreme rainfall, flash flooding, river flooding, landslides, debris flows, and heavy mountain snowfall. In October 2021, NOAA reported that an atmospheric river delivered more than half a foot of rain to portions of the San Francisco Bay Area, producing flash floods, mudslides, and damaging winds while simultaneously generating heavy snowfall in the Sierra Nevada.
Western North America
Western North America has become one of the world's most visible examples of atmospheric river impacts. During December 2022 and January 2023, California experienced nine consecutive atmospheric rivers, the longest period of continuous atmospheric river activity ever observed in the state. Several additional atmospheric rivers struck in March 2023, producing widespread flooding and mountain snowfall. According to the California Department of Water Resources, the statewide snowpack reached approximately 237% of normal by the end of March, among the deepest ever recorded.
Atmospheric rivers increasingly interact with other climate extremes. In October 2023, Tropical Storm Otis explosively intensified into Category 5 Hurricane Otis in only twelve hours, becoming the strongest hurricane ever recorded on Mexico's Pacific coast. Hurricane expert Kerry Emanuel stated that global warming had supercharged the storm. Historically, hurricane intensification has been strongly linked to ocean surface temperatures. Otis, however, was additionally fueled by record ocean warmth extending deeper into the water column. NOAA reported that landslides in mountainous terrain prevented emergency crews from reaching Acapulco and complicated disaster response efforts.
Eastern North America
Traditionally, atmospheric rivers in the United States were primarily associated with the West Coast. Today, there is growing recognition that atmospheric rivers are also major contributors to extreme precipitation events along the East Coast and far inland across eastern North America.
The Eastern United States is already experiencing increasingly destructive episodes of violent rain, including historic flooding in Kentucky in 2022 and 2023, catastrophic flooding in Vermont and New York, and repeated billion-dollar disasters in Florida, South Carolina, and North Carolina. Atmospheric rivers have contributed to numerous East Coast flood events, with some transporting tropical moisture from the Gulf of Mexico, Caribbean Sea, and western Atlantic deep into the interior of the continent.
The Fourth National Climate Assessment documented a substantial increase in heavy precipitation events across the Northeast and projects continued increases in precipitation, particularly during winter and spring. Some of the largest increases in extreme precipitation observed anywhere in the United States have occurred in the Northeast.
Research increasingly shows that East Coast atmospheric rivers occur more frequently than many people realize. While historically receiving less scientific and media attention than their West Coast counterparts, East Coast atmospheric rivers are now recognized as major contributors to heavy precipitation and severe weather. Studies using observations and high-resolution climate models have documented a notable increase in atmospheric river frequency over the Eastern United States during recent decades.
In March 2024, NOAA and the National Weather Service highlighted the growing importance of East Coast atmospheric rivers and their relationship with shifts in the
Pacific-North America (PNA) teleconnection pattern.
These shifts are also associated with changes in the position and behavior of
the midlatitude jet stream,
which plays a crucial role in steering atmospheric rivers and determining where their moisture is ultimately deposited.
Many East Coast atmospheric rivers appear to be intensifying, likely as a result of climate change. The study
Identifying Eastern US Atmospheric River Types and Evaluating Historical Trends
found that increasing moisture transport could significantly elevate the risk of extreme precipitation from Washington, D.C., to coastal Maine. Most East Coast atmospheric rivers are associated with extratropical cyclones, coastal low-pressure systems, and nor'easters, which can generate some of the strongest atmospheric rivers in the region.
Some atmospheric river events along the East Coast now transport more water vapor than historical events of comparable size and are penetrating farther inland than previously observed. Moisture-rich atmospheric rivers have been linked to flooding events extending well into Appalachia and the Ohio Valley, regions that historically experienced less frequent exposure to these types of moisture transport events.
Greenland and the Arctic
Perhaps even more remarkable is the emergence of atmospheric rivers in regions where they were once rare. Greenland is increasingly experiencing atmospheric river intrusions that transport warm, moisture-laden air into the Arctic. These events can produce rainfall at exceptionally high latitudes and trigger widespread surface melting of the Greenland Ice Sheet.
Recent studies indicate that atmospheric rivers have become major contributors to extreme Greenland melt events, accounting for a disproportionate share of the most severe melting episodes. Rainfall generated by atmospheric rivers darkens snow and ice surfaces, reduces reflectivity (albedo), and accelerates melting. Some atmospheric river events have produced rainfall at elevations and latitudes where rain was historically uncommon or nearly absent.
Atmospheric rivers are also increasingly influencing Antarctica, northern Europe, and parts of the Arctic that historically experienced relatively limited moisture transport. Scientists have linked some Antarctic extreme melting events to powerful atmospheric rivers that transported subtropical heat and moisture thousands of miles toward the polar regions.
How Fast Are Atmospheric Rivers Gaining Frequency and Intensity?
While rates of change vary by region and by storm type, there is growing evidence that atmospheric rivers are becoming wetter, more energetic, and increasingly capable of producing extreme impacts. Because atmospheric rivers derive their power from water vapor transport, the thermodynamic effects of climate change directly amplify their destructive potential. Every additional degree of warming increases the atmosphere's moisture-holding capacity by approximately 7%, increasing the amount of water available for transport and precipitation.
As the atmosphere behaves like an expanding sponge, atmospheric rivers increasingly act like moving firehoses, transporting unprecedented quantities of moisture across continents and into regions where such events were historically rare. In many locations, drainage systems, river channels, hillsides, and coastlines evolved under climatic conditions that no longer exist.
Atmospheric rivers are no longer merely a West Coast phenomenon. They are becoming increasingly global in reach and impact, delivering unprecedented amounts of moisture to eastern North America, Greenland, polar regions, and other locations where such events were historically uncommon. As ocean temperatures and atmospheric moisture continue to rise, these rivers in the sky are increasingly becoming one of the defining mechanisms through which climate change transforms drought into deluge and reshapes landscapes across the planet.
Conclusion: A Planet of Increasing Hydrological Extremes
Human activities are warming the Earth and fundamentally altering the global water cycle. Excess heat trapped by greenhouse gases is accumulating primarily in the oceans, while meltwater from the polar regions is being mixed into and transported through an increasingly energetic climate system. Warmer oceans evaporate more water, and warmer air can hold substantially more moisture. On average, water vapor remains in the atmosphere for approximately nine days before returning to the surface as precipitation, allowing moisture and heat to be transported thousands of miles from their source regions.
This additional atmospheric moisture is transforming the character of precipitation itself. Through the physics described by the Clausius-Clapeyron relationship, every degree of warming increases the atmosphere's moisture-holding capacity by approximately 7%. The result is not merely more rain, but increasingly concentrated and energetic episodes of rainfall. Larger amounts of water are being moved through the atmosphere, atmospheric rivers are becoming more influential in regions where they were historically uncommon, and precipitation is increasingly being released in short, intense bursts that overwhelm natural and human systems alike.
The consequences are already visible around the world. Flood-control systems are failing. Stormwater infrastructure is being overwhelmed. Hillsides are collapsing, coastlines are eroding, and flash floods are becoming increasingly destructive. Hydroclimatic whiplash is rapidly swinging regions between drought and deluge, while atmospheric rivers transport unprecedented amounts of moisture deep into continental interiors and even toward polar regions such as Greenland. The landscapes, waterways, and infrastructure upon which civilization developed evolved under climatic conditions that are rapidly disappearing.
Viewed together, violent rain, atmospheric rivers, hydroclimatic whiplash, storm surge, flooding, landslides, lightning, and post-fire debris flows are not isolated phenomena. They are interconnected expressions of a single underlying process: a warmer planet carrying more heat, more moisture, and more energy through the hydrological cycle.
Among the most immediate planetary threats posed by climate change is violent rain—the increasingly destructive release of liquefied atmospheric water vapor. At the same time, one of the greatest near-term threats to human health is deadly humid heat—hot, moisture-laden air that pushes human physiological limits. Together, these twin manifestations of a warming atmosphere demonstrate a fundamental reality of climate change: as the atmosphere stores more water and energy, the Earth's hydrological cycle becomes increasingly volatile, amplifying risks to ecosystems, infrastructure, economies, and human life.
Climate change is increasing the amount of energy violent rain events contain, amplifying how much damage they can inflict.
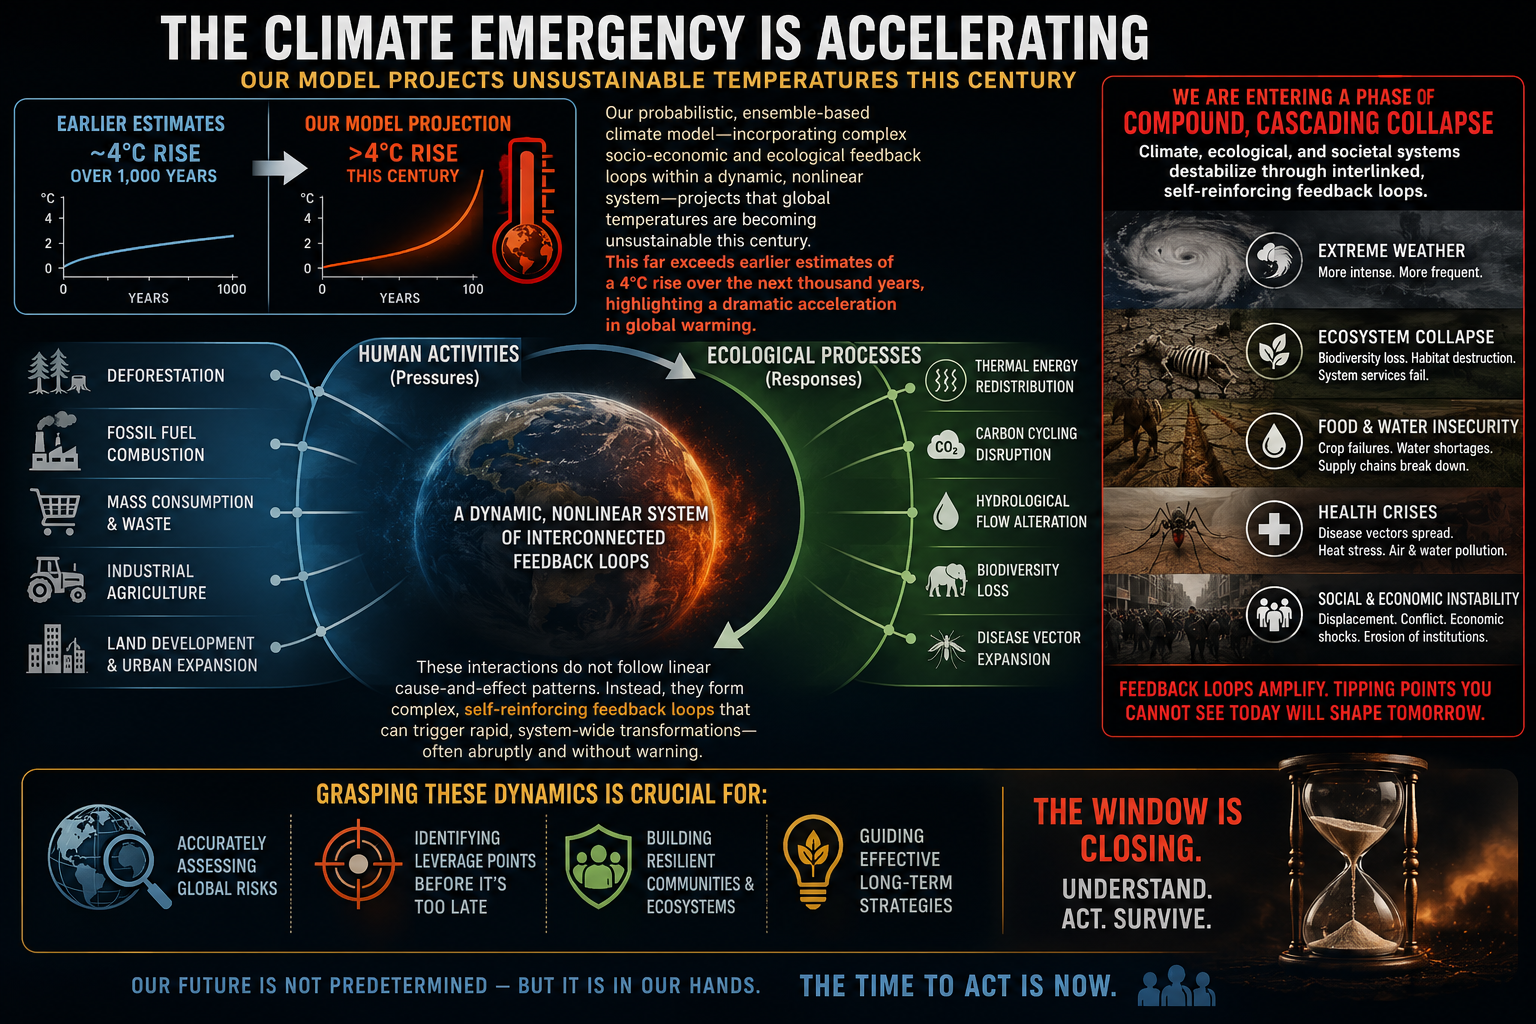
We examine how human activities — such as deforestation, fossil fuel combustion, mass consumption, industrial agriculture, and land development — interact with ecological processes like thermal energy redistribution, carbon cycling, hydrological flow, biodiversity loss, and the spread of disease vectors. These interactions do not follow linear cause-and-effect patterns. Instead, they form complex, self-reinforcing feedback loops that can trigger rapid, system-wide transformations — often abruptly and without warning. Grasping these dynamics is crucial for accurately assessing global risks and developing effective strategies for long-term survival.
Feedback Loops → Tipping Points → Acceleration → Domino Effect
Feedback loops amplify climate change and can push interconnected Earth systems past critical tipping points. As tipping points are crossed, they can trigger additional feedback loops and destabilize other climate systems. This cascading "Domino Effect" compresses timescales, accelerates change, and increases the risk of rapid, nonlinear climate transformations.
Bottom line:The question is no longer how warm the planet becomes, but how life on Earth can endure when change outpaces our ability to adapt.
We cannot control the laws of physics, but we can control our pollution. The most effective action is to stop burning fossil fuels.