Posts Tagged ‘climate change’

Global Warming Refuge

Monday, April 30th, 2012

Ocean currents may mitigate warming near handful of equatorial islands

Photo of a coral reef near the island nation of Kiribati.
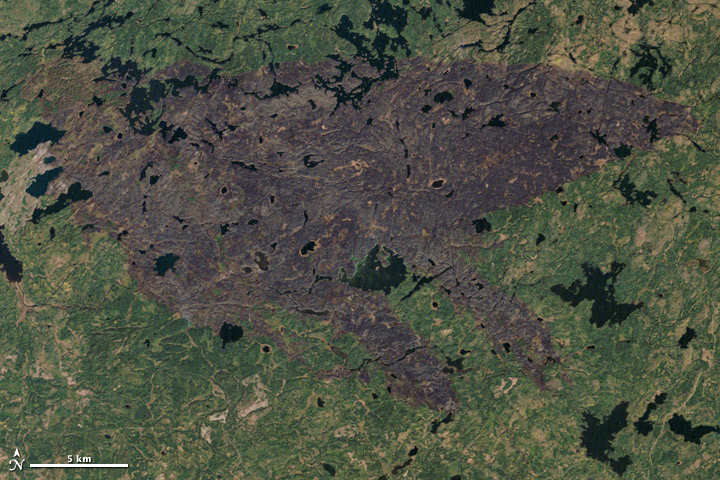
Coral reefs near the island nation of Kiribati may be somewhat protected from global warming.
Credit and Larger Version

Scientists predict ocean temperatures will rise in the equatorial Pacific by the end of the century, wreaking havoc on coral reef ecosystems.

But a new study shows that climate change could cause ocean currents to operate in a way that mitigates warming near a handful of islands right on the equator.

Those islands include some of the 33 coral atolls that form the nation of Kiribati. This low-lying country is at risk from sea-level rise caused by global warming.

Surprisingly, these Pacific islands within two degrees north and south of the equator may become isolated climate change refuges for corals and fish.

“The finding that there may be refuges in the tropics where local circulation features buffer the trend of rising sea surface temperature has important implications for the survival of coral reef systems,” said David Garrison, program director in the National Science Foundation’s (NSF) Division of Ocean Sciences, which funded the research.

Here’s how it could happen, according to the study by Woods Hole Oceanographic Institution (WHOI) scientists Kristopher Karnauskas and Anne Cohen, published today in the journal Nature Climate Change.

At the equator, trade winds push a surface current from east to west.

About 100 to 200 meters below, a swift countercurrent develops, flowing in the opposite direction.

This, the Equatorial Undercurrent (EUC), is cooler and rich in nutrients. When it hits an island, like a rock in a river, water is deflected upward on an island’s western flank.

This upwelling process brings cooler water and nutrients to the sunlit surface, creating localized areas where tiny marine plants and corals flourish.

On color-enhanced satellite maps showing measurements of global ocean chlorophyll levels, these productive patches of ocean stand out as bright green or red spots–for example, around the Galapagos Islands in the Eastern Pacific.

But as you gaze west, chlorophyll levels fade like a comet tail, giving scientists little reason to look closely at scattered low-lying coral atolls in that direction.

These islands are easy to overlook because they are tiny, remote, and lie at the far left edge of standard global satellite maps that place continents in the center.

Karnauskas, a climate scientist, was working with coral scientist Cohen to explore how climate change would affect central equatorial Pacific reefs.

When he changed the map view on his screen in order to view the entire tropical Pacific at once, he saw that chlorophyll concentrations jumped up again exactly at the Gilbert Islands on the equator.

Satellite maps also showed cooler sea surface temperatures on the west sides of these islands, part of Kiribati.

“I’ve been studying the tropical Pacific Ocean for most of my career, and I had never noticed that,” he said. “It jumped out at me immediately, and I thought, ‘there’s probably a story there.’”

So Karnauskas and Cohen began to investigate how the EUC would affect the equatorial islands’ reef ecosystems, starting with global climate models that simulate effects in a warming world.

Global-scale climate models predict that ocean temperatures will rise nearly 3 degrees Celsius (5.4 degrees Fahrenheit) in the central tropical Pacific.

Warmer waters often cause corals to bleach, a process in which they lose the tiny symbiotic algae that live in them and provide vital nutrition.

Bleaching has been a major cause of coral mortality and loss of coral reef area during the last 30 years.

Even the best global models, with their planet-scale views and lower resolution, cannot predict conditions in areas as small as these small islands, Karnauskas said.

So the scientists combined global models with a fine-scale regional model to focus on much smaller areas around minuscule islands scattered along the equator.

To accommodate the trillions of calculations needed for such small-area resolution, they used the new high-performance computer cluster at WHOI called “Scylla.”

“Global models predict significant temperature increases in the central tropical Pacific over the next few decades, but in truth conditions can be highly variable across and around a coral reef island,” Cohen said.

“To predict what the coral reef will experience in global climate change, we have to use high-resolution models, not global models.”

The model predicts that as air temperatures rise and equatorial trade winds weaken, the Pacific surface current will also weaken by 15 percent by the end of the century.

The then-weaker surface current will impose less friction and drag on the EUC, so this deeper current will strengthen by 14 percent.

“Our model suggests that the amount of upwelling will actually increase by about 50 percent around these islands and reduce the rate of warming waters around them by about 0.7 C (1.25 F) per century,” Karnauskas said.

A handful of coral atolls on the equator, some as small as 4 square kilometers (1.54 square miles) in area, may not seem like much.

But Karnauskas’ and Cohen’s results say that waters on the western sides of the islands will warm more slowly than at islands 2 degrees, or 138 miles, north and south of the equator that are not in the path of the EUC.

That gives the Gilbert Islands a significant advantage over neighboring reef systems.

“While the mitigating effect of a strengthened Equatorial Undercurrent will not spare corals the perhaps-inevitable warming expected for this region, the warming rate will be slower around these equatorial islands,” Karnauskas said.

“This may allow corals and their symbiotic algae a better chance to adapt and survive.”

If the model holds true, even if neighboring reefs are hard-hit, equatorial island coral reefs may survive to produce larvae of corals and other reef species.

Like a seed bank for the future, they might be a source of new corals and other species that could re-colonize damaged reefs.

“The globe is warming, but there are things going on underfoot that will slow that warming for certain parts of certain coral reef islands,” said Cohen.

“These little islands in the middle of the ocean can counteract global trends and have a big effect on their own future,” Karnauskas said, “which I think is a beautiful concept.”

-NSF-

Fires In Nepal

Saturday, April 28th, 2012

EARTH –

Numerous forest fires were burning throughout Nepal when the Moderate Resolution Imaging Spectroradiometer (MODIS) instrument on NASA’s Aqua satellite captured this image of the Siwalik Hills on April 24, 2012.

Nepalese officials say they have counted at least 225 fires burning; the largest has destroyed more than 600 hectares (1,480) acres of forest. Officials say the fires have been caused by a long dry spell, windy weather, and discarded cigarettes. There were 1,857 active fires last year, a relatively small number compared to the 4,217 that occurred in 2009, an exceptionally dry year.

“This might be the peak time for fire incidents for this season. However, the rise in the mercury might give rise to more devastating forest fires across the country,” Sundar Prasad Sharma, the coordinator at the UN International Strategy for Disaster Reduction-South Asia Wildland Fire Network, told the Kathmandu Post.

Nepalese officials are currently testing a pilot version of a new wildfire monitoring system based on data from MODIS. Interactive maps showing fire locations are available here.

NASA image by Jeff Schmaltz, LANCE MODIS Rapid Response. Caption by Adam Voiland.

Instrument:
Aqua – MODIS
Fires in Nepal

acquired April 24, 2012 download large image (429 KB, JPEG, 2000×1600)

More Information On Global Warming

Antarctica Ice Loss

Thursday, April 26th, 2012

Warm Ocean Currents Cause Majority of Ice Loss from Antarctica

WASHINGTON, DC (USA) — Warm ocean currents attacking the underside of ice shelves are the dominant cause of recent ice loss from Antarctica, a new study using measurements from NASA’s Ice, Cloud, and land Elevation Satellite (ICESat) revealed.

An international team of scientists used a combination of satellite measurements and models to differentiate between the two known causes of melting ice shelves: warm ocean currents thawing the underbelly of the floating extensions of ice sheets and warm air melting them from above. The finding, published today in the journal Nature, brings scientists a step closer to providing reliable projections of future sea level rise.

The researchers concluded 20 of the 54 ice shelves studied are being melted by warm ocean currents. Most of these are in West Antarctica, where inland glaciers flowing down to the coast and feeding into these thinning ice shelves have accelerated, draining more ice into the sea and contributing to sea-level rise. This ocean-driven thinning is responsible for the most widespread and rapid ice losses in West Antarctica and the majority of Antarctic ice sheet loss during the period studied.

“We can lose an awful lot of ice to the sea without ever having summers warm enough to make the snow on top of the glaciers melt,” said the study’s lead author Hamish Pritchard of the British Antarctic Survey in Cambridge, United Kingdom. “The oceans can do all the work from below.”

To map the changing thickness of almost all the floating ice shelves around Antarctica, the team used a time series of 4.5 million surface height measurements taken by a laser instrument mounted on ICESat from October 2003 to October 2008. They measured how the ice shelf height changed over time and ran computer models to discard changes in ice thickness because of natural snow accumulation and compaction. The researchers also used a tide model that eliminated height changes caused by tides raising and lowering the ice shelves.

“This study demonstrates the power of space-based, laser altimetry for understanding Earth processes,” said Tom Wagner, cryosphere program scientist at NASA Headquarters in Washington.” Coupled with NASA’s portfolio of other ice sheet research using data from our GRACE mission, satellite radars and aircraft, we get a comprehensive view of ice sheet change that improves estimates of sea level rise.”

Previous studies used satellite radar data to measure the evolution of ice shelves and glaciers, but laser measurements are more precise in detecting changes in ice shelf thickness through time. This is especially true in coastal areas. Steeper slopes at the grounding line, where floating ice shelves connect with the landmass, cause problems for lower-resolution radar altimeters.

ICESat was the first satellite specifically designed to use laser altimetry to study the Earth’s polar regions. It operated from 2003 to 2009. Its successor, ICESat-2, is scheduled for launch in 2016.

“This study demonstrates the urgent need for ICESat-2 to get into space,” said Jay Zwally, ICESat project scientist at NASA’s Goddard Space Flight Center in Greenbelt, Md. “We have limited information on the changes in polar regions caused by climate change. Nothing can look at these changes like satellite measurements do.”

The new research also links the observed increase in melting that occurs on the underside of a glacier or ice shelf, called basal melt, and glacier acceleration with changes in wind patterns.

“Studies have shown Antarctic winds have changed because of changes in climate,” Pritchard said. “This has affected the strength and direction of ocean currents. As a result warm water is funnelled beneath the floating ice. These studies and our new results suggest Antarctica’s glaciers are responding rapidly to a changing climate.”

A different picture is seen on the Antarctic Peninsula, the long stretch of land pointing towards South America. The study found thinning of the largest ice shelf on the peninsula can be explained by warm summer winds directly melting the snow on the ice shelf surfaces. The patterns of widespread ocean-driven melting and summer melting on the Antarctic Peninsula can be attributed to changing wind patterns.

The study was carried out by an international team from the British Antarctic Survey, Utrecht University in Utrecht, Netherlands, the University of California in San Diego and the non-profit research institute Earth and Space Research in Corvallis, Ore.

For more information, a visualization and related imagery, visit:

http://www.nasa.gov/topics/earth/features/currents-ice-loss.html

For more information about ICESat and ICESat-2, visit:

http://icesat.gsfc.nasa.gov

Gummi Bears: Expert Says Global Warming May Be The End

Monday, April 16th, 2012

WEST CHESTER, PENNSYLVANIA, USA — Will human induced climate change cause the extinction of the Gummi Bear? An expert from West Chester University says, “Yes.”

Stay tuned for the gooey details.

More from the experiment “Human Induced Climate Change”

Burn Scar

Thursday, October 13th, 2011

Burn scar from fires in Minnesota

Nearly two months after being ignited by lightning, the Pagami Creek Fire in northern Minnesota was nearly contained when Landsat-5 acquired this image on October 10, 2011. Since August 18, the fire has been burning in the Boundary Waters Canoe Area Wilderness in Superior National Forest. As of October 11, the fire had burned 92,682 acres and was 82 percent contained. Apart from a faint hint of smoke, there is little sign of current fire activity in the image. The burned forest, however, is charcoal-colored, in contrast to the green forest around it.

  1. Reference

  2. InciWeb. (2011, October 11). Pagami Creek Fire. Accessed October 11, 2011.

NASA Earth Observatory image created by Jesse Allen and Robert Simmon, using Landsat data provided by the United States Geological Survey. Caption by Holli Riebeek.

Instrument:
Landsat 5 – TM

Flooding From Japan’s Earthquake Tsunami

Saturday, March 12th, 2011
Flooding From Tsunami

Flooding From Tsunami

Japan's Coast Before the Earthquaker

Japan's Coast Before the Earthquaker

NASA’s Terra satellite’s first view of northeastern Japan in the wake of a devastating earthquake and tsunami reveal extensive flooding along the coast. The Moderate Resolution Imaging Spectroradiometer (MODIS) acquired the top image of the Sendai region on March 12, 2011, at 10:30 a.m. The lower image, taken by Terra MODIS on February 26, 2011, is provided as a point of reference.

Water is black or dark blue in these images. It is difficult to see the coastline in the March 12 image, but a thin green line outlines the shore. This green line is higher-elevation land that is above water, presumably preventing the flood of water from returning to the sea. The flood indicator on the lower image illustrates how far inland the flood extends.

Both images were made with infrared and visible light, a combination that increases the contrast between muddy water and land. Plant-covered land is green, while snow-covered land is pale blue. Clouds are white and pale blue. The paved surfaces in the city of Sendai colors it brown.

MODIS detected a fire burning near the shore north of Sendai. The fire is marked with a red box. It is also surrounded by floods.

The photo-like true-color image acquired a few hours later shows plumes of sediment washed into the ocean along the coast and a dark plume of smoke near Sendai. Both images are from the MODIS Rapid Response System, which provides twice-daily images of Japan.

NASA images courtesy the MODIS Rapid Response Team at NASA GSFC. Caption by Holli Riebeek.

Instrument: Terra – MODIS

Increased Ethanol In Gasoline

Thursday, March 3rd, 2011

There are concerns about using ethanol in gasoline. It is possible that ethanol is actually worse for the environment and increasing the rate of global warming; however, the EPA is allowing E15.

E15 (a blend of gasoline and ethanol)

In response to a request by Growth Energy under section 211(f)(4) of the Clean Air Act, the Environmental Protection Agency (EPA) has partially granted a waiver to allow fuel and fuel additive manufacturers to introduce into commerce gasoline that contains greater than 10 volume percent (vol%) ethanol and up to 15 vol% ethanol (E15) for use in model year (MY) 2001 and newer light-duty motor vehicles, subject to several conditions. On October 13, 2010, EPA granted a partial waiver for E15 for use in MY2007 and newer light-duty vehicles (i.e., cars, light-duty trucks and medium-duty passenger vehicles). On January 21, 2011, EPA granted a partial waiver for E15 for use in MY2001-2006 light-duty motor vehicles. These decisions were based on test results provided by the U.S. Department of Energy (DOE) and other information regarding the potential effect of E15 on vehicle emissions. Taken together, the two actions allow, but do not require, E15 to be introduced into commerce for use in MY2001 and newer light-duty motor vehicles if conditions for mitigating misfueling and ensuring fuel quality are met. EPA is in the process of completing work on regulations that would provide a more practical means of meeting the conditions.

Prior to the distribution of E15, fuel and fuel additive manufacturers are required to register the fuel with EPA. For more information on fuel registration visit the Registration and Health Effect Testing page. There are also a number of other actions including changes to various state and local laws that may also affect the distribution of E15.

What is E15?

Ethanol is an alcohol that can be mixed with gasoline to result in a cleaner-burning fuel. The most common blend of gasoline and ethanol is E10, or 10 percent of ethanol to 90 percent of gasoline. E10 was granted a waiver under Clean Air Act section 211(f)(4) by operation of law over 30 years ago. E15 is gasoline containing 15 vol% ethanol.

The primary source of ethanol is corn, but other grains or biomass sources may be used.
What is the E15 waiver?

In order to protect the emission control systems of vehicles and engines, the Clean Air Act prohibits the introduction of fuels or fuel additives that are not substantially similar to the fuels or fuel additives used in certifying vehicles and engines to emission standards. However, the Act authorizes EPA to grant a waiver of this prohibition for a fuel or fuel additive if it can be demonstrated that vehicles and engines using the otherwise prohibited fuel or fuel additive will continue to meet emission standards over their “full useful life” (100,000 or 120,000 miles, depending on the vehicle type and model year).

In March 2009, Growth Energy (a coalition of U.S. ethanol supporters) and 54 ethanol manufacturers applied for a waiver to increase the allowable amount of ethanol in gasoline from E10 to E15. The waiver application included data on the impact of E15 on vehicle emissions, fuel system materials, and driveability. Additional data were developed by DOE, which in 2008 began testing for potential impacts of various ethanol-gasoline blends on emissions of MY2007 and newer light-duty motor vehicles. This testing followed enactment of the Energy Independence and Security Act of 2007, which calls for significantly increasing the amount of biofuels, such as ethanol, to be used in transportation fuel. EPA received over 78,000 public comments about Growth Energy’s application.

Initially, EPA partially granted Growth Energy’s waiver request application. Based in large part on DOE test data, the Agency approved the waiver for and allowed the introduction into commerce of E15 for use in MY2007 and newer light-duty motor vehicles, subject to certain conditions. EPA did not approve the waiver for E15 use in MY2000 and older light-duty motor vehicles, heavy-duty gasoline engines and vehicles (e.g., delivery trucks), highway and off-highway motorcycles, and nonroad engines, vehicles, and equipment (e.g., boats, snowmobiles, and lawnmowers) due to insufficient test data or other information to support a waiver for these vehicles and engines. At the time of the announcement in October, EPA deferred action on E15 for use in MY2001-2006 light-duty motor vehicles until DOE test data for those model years became available.

On January 21, 2011, after DOE test data were made available to the public (see EPA Docket #EPA-HQ-OAR-2009-0211 at www.regulations.gov), EPA took further action on Growth Energy’s waiver request application to approve the introduction into commerce of E15 for use in MY 2001-2006 and newer light-duty motor vehicles, subject to the same conditions that apply to the partial waiver decision for later model year vehicles. Taken together, the two waiver decisions allow the introduction into commerce of E15 for use in MY2001 and newer light-duty motor vehicles if the waiver conditions are met.
What Vehicles May Use E15?

* Flexible-fuel vehicles (FFVs).
* MY2001 and newer cars.
* MY2001 and newer light-duty trucks.
* MY2001 and newer medium-duty passenger vehicles. (SUVs).

top of page
What Vehicles and Engines May Not Use E15?

* All motorcycles.
* All vehicles with heavy-duty engines, such as school buses, transit buses, and delivery trucks.
* All off-road vehicles, such as boats and snowmobiles.
* All engines in off-road equipment, such as lawnmowers and chain saws.
* All MY2000 and older cars, light-duty trucks, and medium-duty passenger vehicles (SUVs).

top of page
What Conditions are Part of the Waiver Decision?

EPA placed two types of conditions on the waiver for E15: those for mitigating the potential for misfueling of E15 into vehicles, engines and equipment for which E15 is not approved, and those addressing fuel and ethanol quality. All conditions must be met prior to the introduction of E15 into commerce.

Fuel quality conditions:

* Ethanol used for E15 must meet ASTM International D4806-10.
* The Reid Vapor Pressure for E15 is limited to 9.0 psi during the summertime.

Misfueling mitigation conditions:

* Labels must be placed on E15 retail dispensers indicating that E15 use is only for MY2001 and newer motor vehicles.
* Product Transfer Documents (PTDs) must accompany all transfers of fuels for E15 use.
* Parties involved in the manufacture of E15 must participate in a survey of compliance at fuel retail dispensing facilities to ensure proper labeling of dispensers.
* Parties must submit a plan addressing conditions to EPA for approval.

top of page
What is EPA doing to Address Potential Misfueling?

EPA is in the process of establishing a regulatory program to help mitigate potential misfueling of vehicles, engines, and equipment for which E15 is not approved. Concurrently with the October 13, 2010 partial waiver decision, the Agency proposed a rule that would require all E15 fuel dispensers to have a label if a retail station chooses to sell E15, and sought comment on separate labeling requirements for fuel blender pumps and fuel pumps that dispense E85. Similar to the prohibition in Clean Air Act section 211(f)(1), the rule would prohibit the use of gasoline containing greater than 10 vol% ethanol in vehicles and engines not covered by the partial waiver for E15. In addition, the rule would require PTDs specifying ethanol content and Reid Vapor Pressure (RVP) to accompany the transfer of gasoline blended with ethanol and a national survey of retail stations to ensure compliance with these requirements. The rule would also modify the Reformulated Gasoline (RFG) program by updating the Complex Model to allow fuel manufacturers to certify batches of gasoline containing up to E15. The measures were designed to help promote the successful introduction of E15 into commerce.

EPA held a public hearing on the proposed rule in November and provided a 60-day public comment period that ended on January 3, 2011.

top of page
Notices and Updates
NOTE: You will need Adobe Acrobat Reader, available as a free download, to view some of the files on this page. See EPA’s PDF page to learn more about PDF, and for a link to the free Acrobat Reader.

Under the authority of Clean Air Act section 211(f)(4), EPA may consider the March 2009 application from Growth Energy for a waiver for a gasoline-ethanol blend with up to 15 vol% ethanol (E15) to be used in non-flexible-fueled vehicles.

EPA reviewed Growth Energy’s application along with available test data, other information and public comments. On October 13, 2010, EPA determined that, subject to compliance with the conditions listed in the waiver decision, a gasoline produced with greater than 10 volume percent (vol%) ethanol and up to 15 vol% ethanol will not cause or contribute to a failure of MY 2007 and newer cars, light-duty trucks and medium-duty passenger motor vehicles to achieve compliance with applicable emission standards over the vehicles’ full useful life. Therefore, EPA partially and conditionally granted Growth Energy’s waiver request for a gasoline-ethanol blend with up to 15 vol% ethanol. On January 21, 2011, EPA took further action on Growth Energy’s waiver request and granted a partial waiver for E15 use in MY 2001-2006 cars, light duty trucks and medium-duty passenger vehicles, subject to the same conditions that apply to the partial waiver for newer light-duty motor vehicles.

* Partial waiver for use of E15 in MY2001-2006 light-duty motor vehicles | PDF Version (22 pp; 2.7MB; January 26, 2011)
* Fact Sheet: EPA Announces E15 Partial Waiver Decision | PDF Version (3 pp; 510K; EPA-420-F-11-003; January 21, 2011)
* Partial waiver for use of E15 in MY2007 and newer light-duty motor vehicles | PDF Version (58 pp, 4.57M, published November 4, 2010)
* Status Update (July 2010)
* Status Update (PDF) (2 pp, 493K, November 30, 2009)
* Extension of Comment Period: Notice | PDF Version (2 pp, 75K, published May 20, 2009)
* Notice of Receipt of Waiver Application | PDF Version (3 pp, 77K, published April 21, 2009)

For further information or assistance, please contact Robert Anderson (anderson.robert@epa.gov) or at 202-343-9718.

Oldest Northern North American Human

Friday, February 25th, 2011

North American Archaeological Dig

North American Archaeological Dig

Many people believe human life started in Africa; however, is it possible the Garden of Eden was in North America?


The National Science Foundation scientists and Alaska Natives collaborate on find of cremated child.

Newly excavated remains found at the Xaasaa Na’ archaeological site near the Tanana River in central Alaska may belong to one of the earliest inhabitants of North America.

The remains of an individual, estimated to be about three-years old at the time of death, may provide rare insights into the burial practices of Ice Age peoples, while shedding new light on their daily lives, according to a paper published Feb. 25 in the journal Science.

Researchers, who named the child Xaasaa Cheege Ts’eniin (pronounced hausau chag ts’eneen), which translates to “Upward Sun River Mouth Child,” based on a local native place name, said the remains would be the oldest found in Northern North America, as well as the second youngest Ice Age child on the continent.

The find also is notable because archaeologists and Alaska Natives are working hand-in-hand to insure the excavation and subsequent examination of the child’s remains.

Ben Potter, an archaeologist at the University of Alaska Fairbanks, and his colleagues describe in the paper finding the skeletal remains in an ancient fire pit within an equally ancient dwelling near the Tanana River.

Radiocarbon dating of wood at the site indicates the cremation of the child may have taken place roughly 11,500 years ago, when the Bering Land Bridge may still have connected Alaska with Asia.

Initial observations of the teeth indicate the child is biologically affiliated with Native Americans and with Northeast Asians.

“This site reflects many different behaviors never before seen in this part of the world during the last Ice Age, and the preservation and lack of disturbance allows us to explore the life ways of these ancient peoples in new ways,” Potter says.

The researchers note both the burial and the house itself are the earliest of their kind known in the North American near-Arctic. They add that discovery of burial sites of this age in North America is very rare; the buried remains of children even more so.

“The discovery of the remains was unexpected,” Potter added.

In fact, it was an older occupation at the site–about 13,200 years ago–that first attracted the researchers to the site. Only while investigating this early occupation did the evidence of the burial come to light.

The initial excavation of the site was supported by the National Science Foundation’s Office of Polar Programs with funds awarded under the American Recovery and Reinvestment Act.

OPP’s Division of Arctic Sciences supports disciplinary, multidisciplinary, and broad, interdisciplinary investigations directed toward both the Arctic as a region of special scientific interest and a region important to global systems.

In the paper, the researchers note that the pit contained not only the child’s remains–the researchers estimate less than 20 percent of the skeleton survived the cremation–but also remains of small mammals, birds and fish as well as plant remains. Because the human remains were in the uppermost part of the pit, above the animal remains, the researchers suspect the pit was not originally designed as a grave, but evidence suggests the occupants abandoned the house after the cremation-burial.

Both researchers and tribal leaders agreed that the process of working together on this new find has fostered mutual respect and cooperation between them.

“This exciting, groundbreaking and multi-faceted research is in the best traditions of the research that NSF supports in the Arctic,” said Anna Kerttula de Echave, program officer in the NSF Office of Polar Programs who oversees this award. “Equally significant is that the approach taken by the researchers reflects the importance, in modern Arctic science, of collaborating with Native people as full partners in discovery.”

Potter and his colleagues’ excavation and analysis were sanctioned by the local federally recognized Tribe, Healy Lake Traditional Council and its affiliated regional consortium, Tanana Chiefs Conference (TCC). Through consultation, initiated at the time of the discovery, Healy Lake and TCC support the scientific examination of both the site and the remains themselves.

“I would like to learn everything we can about this individual,” said First Chief Joann Polston, of Healy Lake Traditional Council.

TCC President Jerry Isaac added that “This find is especially important to us since it is in our area, but the discovery is so rare that it is of interest for all humanity.”

Although burned, some of the child’s remains may retain DNA. Isaac intends to have his own DNA compared to the find. Polston would like to expand the opportunity to any Alaska Native in the region.

Based on the stratigraphy–or examination of layers of materials in the fire pit–and other evidence, the researchers describe a possible sequence for how the remains came to be interred at the site.

They hypothesize a small group of people, which included adult females and young children, were foraging in the area in the vicinity of this residential camp, fishing and hunting birds and small mammals.

A pit was dug within a house, used for cooking and/or a means of disposing food debris for weeks or months preceding the death of the child.

The child died and was cremated in the pit.

The pit was likely filled with surrounding soil soon after the body was burned. The house was fairly soon abandoned, they concluded, due to the lack of artifacts found above this fill.

Potter noted the find is significant also because it crosses a number of disciplinary boundaries; the artifacts, features, stratigraphy, preservation, and the human remains. These finds allow for the integration and synthesis of stone tool technology, cultural affiliation, subsistence economy, seasonal use of the landscape, paleoenvironments and climate change at the end of the last Ice Age northern North America.

-NSF-

Media Contacts
Deborah Wing, NSF (703) 292-5344 dwing@nsf.gov
Marmian Grimes, University of Alaska Fairbanks (907) 474-7902 marmian.grimes@alaska.edu

Program Contacts
Anna M. Kertulla, NSF (703)292-7432 akertull@nsf.gov

Principal Investigators
Ben A. Potter, Unversity of Alaska Fairbanks (907) 474-7567 bapotter@alaska.edu

The National Science Foundation (NSF) is an independent federal agency that supports fundamental research and education across all fields of science and engineering. In fiscal year (FY) 2010, its budget is about $6.9 billion. NSF funds reach all 50 states through grants to nearly 2,000 universities and institutions. Each year, NSF receives over 45,000 competitive requests for funding, and makes over 11,500 new funding awards. NSF also awards over $400 million in professional and service contracts yearly.


Home | Contact Us | Internet & Advertising Services