High-Risk U.S. Real Estate Regions Under the Multiplicative Climate Risk Framework
1Independent Climatologist, Economist, Membrane Institute, USA
2Independent Physicist, Membrane Institute, USA
The Multiplicative Climate Risk Formula
Based on: Coupled Climate Feedbacks and Cascading Real Estate Risk
The Multiplicative Climate Risk Formula is a real-estate climate-risk model designed to capture how multiple hazards and vulnerabilities can interact and compound rather than occur independently. The framework incorporates interconnected risks including sea-level rise, storm surge, extreme precipitation, flooding, hydroclimatic whiplash, wildfires, drought, extreme heat, hurricanes, landslides, avalanches, and other cascading hazards.
Rather than treating each hazard as an isolated threat, the model evaluates how hazard exposure, hazard coupling, structural vulnerability, insurance stress, and recovery deficits can multiply overall real-estate risk.
The central premise is simple:
Climate risk is not merely additive. When multiple vulnerabilities interact, their combined impact can be substantially greater than the sum of their individual effects.
Applying the Multiplicative Climate Risk Formula reveals an important characteristic of climate-driven real-estate risk: the highest-risk regions are not necessarily those experiencing the most dramatic individual weather events. The greatest systemic risk emerges where multiple risk dimensions interact and amplify one another.
A region can experience severe hurricanes, wildfires, flooding, or extreme heat without necessarily experiencing the highest level of cascading real-estate risk. The critical question is what happens when physical hazards interact with high exposure, hazard coupling, structural vulnerability, insurance-market stress, and limited recovery capacity.
The framework therefore evaluates five interacting dimensions:
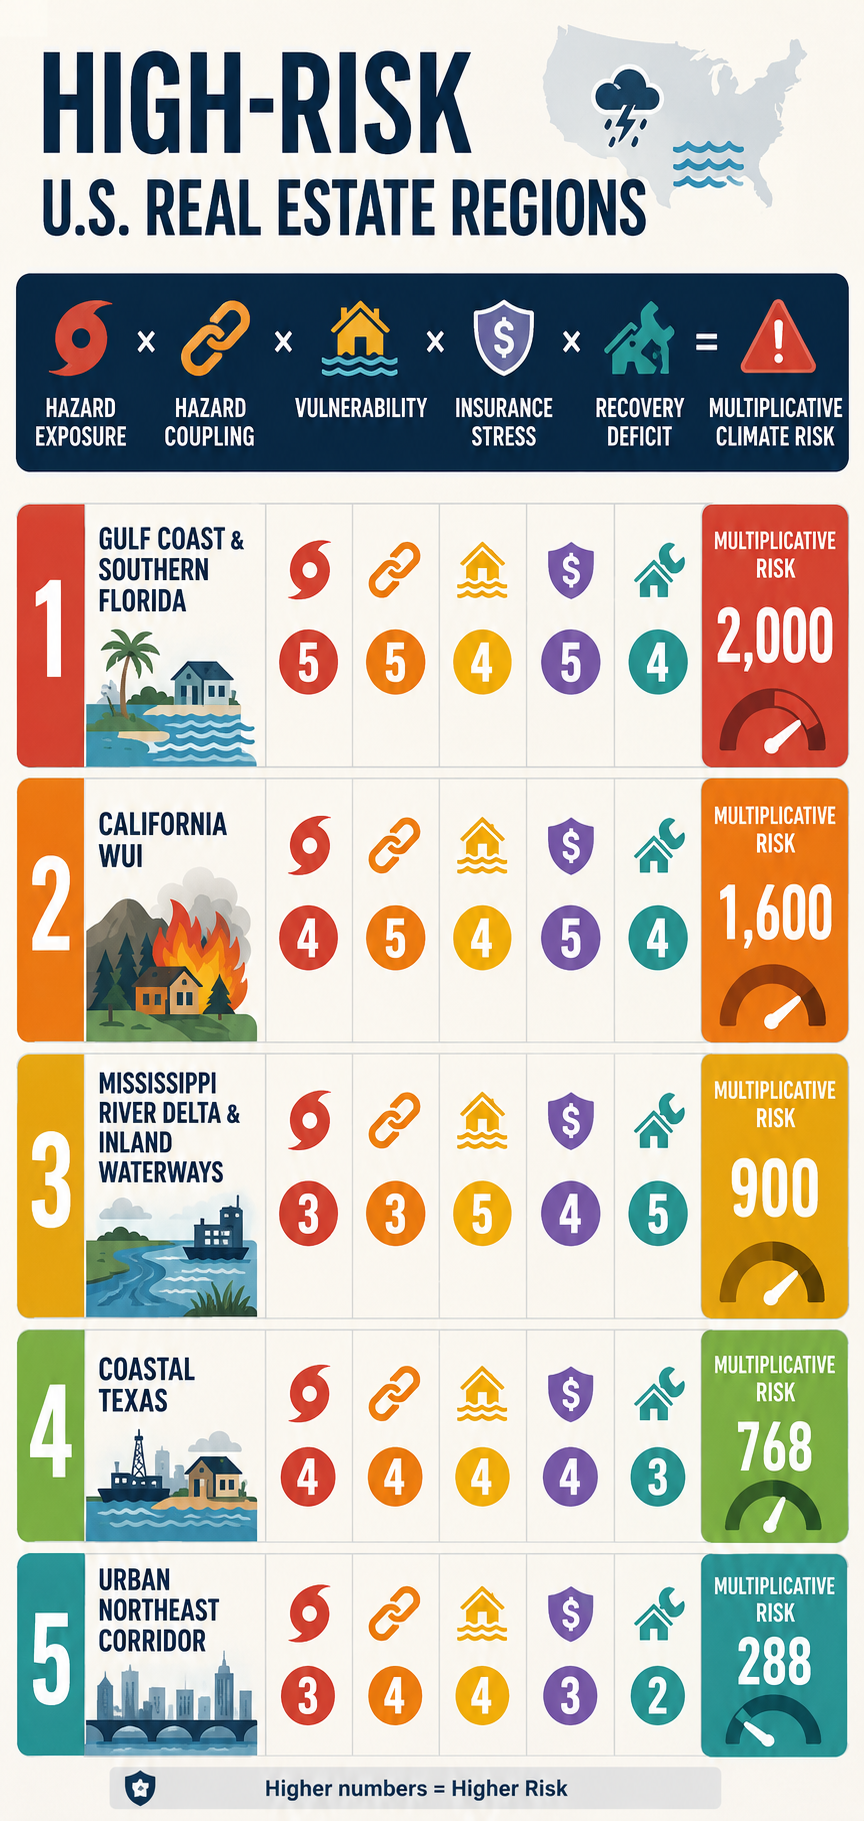
Hazard Exposure × Hazard Coupling × Vulnerability × Insurance Stress × Recovery Deficit = Multiplicative Climate Risk
Each component is scored from 1 to 5, where:
1 = Low Risk
2 = Moderate-Low Risk
3 = Moderate Risk
4 = High Risk
5 = Extreme Risk
The resulting score is not a probability of loss or a conventional actuarial measure. It is a comparative systems-risk index designed to identify locations where multiple weaknesses can reinforce one another.
This distinction is critical.
A region with a score of 5 in one category but relatively low scores elsewhere may be less systemically exposed than a region scoring 4 or 5 across nearly every category.
The multiplicative framework captures that interaction:
Physical Hazard ↑ + Coupling ↑ + Vulnerability ↑ + Insurance Stress ↑ + Recovery Capacity ↓ → Cascading Real-Estate Risk ↑↑
The following ranking represents a comparative assessment of major U.S. real-estate risk regions, incorporating physical hazards and the increasingly important financial and institutional dimensions of climate exposure.
1. Gulf Coast & Southern Florida
The Compound-Compounding Zone
Hazard Exposure — 5/5
The Gulf Coast and southern Florida face some of the country’s most concentrated combinations of acute and chronic climate hazards.
These include:
Major Hurricanes + Storm Surge + Extreme Rainfall + Sea-Level Rise + Coastal Flooding + Extreme Heat
The region’s vulnerability is not based on any single hazard. It is the convergence of multiple hazards affecting a densely developed coastal real-estate market.
Hazard Coupling — 5/5
The defining characteristic is the interaction among hazards.
A tropical cyclone can simultaneously produce:
Storm Surge + Extreme Rainfall + River Flooding + High Winds
Sea-level rise increases the baseline upon which storm surge occurs, while extreme rainfall can overwhelm drainage systems at the same time that elevated coastal water levels restrict drainage.
The resulting process is:
Hurricane → Storm Surge + Extreme Rainfall → Drainage Impairment → Compound Flooding → Widespread Property Exposure
This is precisely the type of coupled hazard that can produce disproportionate economic consequences.
Vulnerability — 4/5
The region contains enormous quantities of residential, condominium, commercial, and infrastructure assets exposed to coastal and flood hazards.
Building age and construction standards vary substantially. Newer construction and mitigation measures can reduce vulnerability, while older structures and properties with inadequate flood, wind, or drainage protection remain substantially more exposed.
The critical issue is therefore not simply the age of the housing stock, but the mismatch between:
Long-Lived Real Estate Assets → Rapidly Changing Climate Risk
Insurance Stress — 5/5
Insurance is one of the most consequential real-estate constraints in the region.
The combination of hurricanes, storm surge, flooding, wind damage, sea-level rise, and repeated catastrophe losses places substantial pressure on insurance availability and affordability.
The resulting feedback is:
Climate Risk ↑ → Expected Losses ↑ → Insurance Premiums ↑ → Deductibles and Coverage Restrictions ↑ → Insurance Availability ↓
For homeowners, insurance costs directly increase the cost of ownership.
For commercial real estate, rising insurance expenses can reduce net operating income and asset values by increasing operating costs. The effect is particularly significant for multifamily, hospitality, retail, and other income-producing properties.
The insurance problem therefore extends beyond individual policies.
It becomes a real-estate valuation problem:
Insurance Cost ↑ → Cost of Ownership ↑ → Buyer Demand ↓ → Property Values ↓
Recovery Deficit — 4/5
The region’s substantial public and private capital resources provide recovery capacity, but the scale of the infrastructure challenge is enormous.
Long-term pressures include:
Flood-Control Systems + Pump Stations + Drainage Networks + Seawalls + Roads + Bridges + Utilities + Wastewater Systems
The concern is not whether these systems can recover from one disaster.
The concern is whether:
Repeated Damage > Available Recovery and Adaptation Capacity
If the frequency of major events increases faster than infrastructure can be repaired, upgraded, or relocated, a recovery deficit can develop.
Multiplicative Risk
5 × 5 × 4 × 5 × 4 = 2,000
Total Risk Factor: 2,000
The Gulf Coast and southern Florida therefore represent the most pronounced example of compound climate-real-estate risk in the framework.
2. Central & Southern California Wildland-Urban Interface
The Fire–Flood–Insurance Cascade Zone
Hazard Exposure — 4/5
The Central and Southern California WUI faces a combination of:
Wildfire + Extreme Heat + Drought + Water Stress + Extreme Rainfall
The exposure is particularly consequential because enormous quantities of residential real estate have been constructed adjacent to or within wildfire-prone landscapes.
Hazard Coupling — 5/5
The defining feedback is:
Drought → Vegetation Stress → Wildfire → Vegetation Loss → Soil Destabilization → Extreme Rainfall → Mudslides and Debris Flows
This is a classic sequential compound-risk mechanism.
Wildfire does not simply produce immediate property losses.
It can alter the landscape in ways that increase the consequences of subsequent precipitation events.
The result is:
Wildfire → Landscape Transformation → Increased Post-Fire Flood/Mudslide Risk
This creates a risk cascade extending beyond the original fire.
Vulnerability — 4/5
Residential development in steep terrain, narrow canyons, and areas with constrained evacuation routes can create substantial exposure.
Vulnerability also depends on construction standards, defensible space, vegetation management, access routes, and the ability of communities to recover rapidly after catastrophic fires.
Insurance Stress — 5/5
California represents one of the clearest examples of insurance-market stress becoming a real-estate problem.
The combination of catastrophic wildfire exposure, rapidly changing risk conditions, and repeated losses creates pressure on insurers to increase premiums, restrict coverage, reduce exposure, or withdraw from high-risk markets.
When private insurance becomes unavailable or unaffordable, property owners may be forced into residual or state-backed insurance mechanisms.
The resulting feedback is:
Wildfire Risk ↑ → Insurance Losses ↑ → Premiums ↑ → Coverage Restrictions ↑ → Private Insurance Availability ↓ → Residual-Market Dependence ↑
This creates a second real-estate feedback:
Insurance Availability ↓ → Financing Constraints ↑ → Buyer Pool ↓ → Property Liquidity ↓ → Property Values ↓
The insurance problem can therefore become a leading indicator of broader real-estate repricing.
Recovery Deficit — 4/5
Large wildfire events can produce extensive reconstruction requirements simultaneously.
The recovery system must contend with:
Destroyed Housing + Infrastructure Damage + Debris Removal + Labor Requirements + Construction Demand + Supply Constraints
The resulting competition for labor and materials can extend rebuilding timelines and increase reconstruction costs.
The longer recovery takes, the greater the potential for:
Recovery Delay → Business Interruption → Household Displacement → Reduced Local Economic Activity → Reduced Community Resilience
Multiplicative Risk
4 × 5 × 4 × 5 × 4 = 1,600
Total Risk Factor: 1,600
The California WUI therefore represents a particularly important example of insurance availability becoming a leading indicator of real-estate climate risk.
3. Coastal Texas
The Industrial and Commercial Risk Hub
Hazard Exposure — 4/5
Coastal Texas faces:
Hurricanes + Storm Surge + Extreme Rainfall + Flash Flooding + Extreme Heat + Grid Stress
The region’s importance is amplified by its enormous concentration of industrial, commercial, petrochemical, port, logistics, and residential assets.
Hazard Coupling — 4/5
The physical hazards can interact through several pathways.
For example:
Extreme Heat → Electricity Demand ↑ → Grid Stress ↑ → Power Disruption → Cooling/Industrial/Commercial Disruption
At the same time:
Hurricane → Wind + Surge + Rainfall → Flooding + Power Loss → Business Interruption
And:
Flooding + Heat + Power Loss → Mold + Water Damage + Equipment Failure + Building-System Damage
This produces a multi-system cascade rather than a single flood loss.
Vulnerability — 4/5
Coastal Texas contains enormous concentrations of development and infrastructure in flood-prone and low-lying areas.
Impervious surfaces can increase runoff, while dense development can make drainage problems more consequential.
The concentration of industrial and commercial assets also creates correlated economic risk.
A single major event can affect multiple businesses, transportation systems, suppliers, utilities, and customers simultaneously.
Insurance Stress — 4/5
Insurance costs and coverage limitations are becoming an increasingly important component of real-estate risk.
Wind, hail, hurricane, flood, and business-interruption exposures can produce substantial premiums and deductibles.
As insurers reassess catastrophe exposure, property owners can increasingly absorb a greater portion of the risk through:
Higher Deductibles + Coverage Restrictions + Increased Premiums + Greater Self-Insurance
For commercial real estate, increasing insurance expenses directly affect:
Operating Expenses ↑ → NOI ↓ → Capitalization Value ↓
This provides a direct financial transmission mechanism between climate risk and commercial property valuation.
Recovery Deficit — 3/5
Coastal Texas possesses substantial private capital and strong economic capacity, which can accelerate reconstruction.
However, public infrastructure and regional systems can take much longer to repair.
The result is a two-speed recovery:
Private Capital → Rapid Property Recovery
while:
Public Infrastructure → Slower System Recovery
This creates a temporary resilience gap.
Multiplicative Risk
4 × 4 × 4 × 4 × 3 = 768
Total Risk Factor: 768
Coastal Texas represents an important example of how high-value commercial real estate can convert physical climate exposure into large-scale correlated financial losses.
4. Mississippi River Delta & Inland Waterways
The Structural-Aging and Recovery-Deficit Zone
Hazard Exposure — 3/5
The Mississippi Delta and associated inland waterways face:
River Flooding + Extreme Rainfall + Severe Convective Storms + Subsidence + Coastal Flooding
The region’s raw hazard exposure is lower than some Gulf Coast locations, but the interaction of hazards with infrastructure and socioeconomic vulnerability dramatically increases systemic risk.
Hazard Coupling — 3/5
One important pathway is:
Upstream Extreme Rainfall → River Discharge ↑ → Downstream Flooding → Prolonged Inundation → Structural and Infrastructure Damage
In coastal portions of the Delta, this can interact with:
River Flooding + Storm Surge + Sea-Level Rise → Compound Inland/Coastal Flooding
The duration of inundation can be as important as peak water depth because prolonged water exposure can increase mold, structural deterioration, electrical damage, and infrastructure failure.
Vulnerability — 5/5
This region’s primary vulnerability is structural.
Risk is amplified by:
Aging Infrastructure + Levee Dependence + Aging Buildings + Economic Constraints + Limited Local Fiscal Capacity
The critical issue is not simply whether flood-control infrastructure exists.
It is whether that infrastructure can be maintained, upgraded, and replaced at the rate required under changing climate conditions.
Insurance Stress — 4/5
Flood insurance is an essential component of property financing in designated high-risk areas where federal requirements apply.
However, the availability and affordability of private flood coverage can vary substantially by location and risk profile.
Where private coverage is limited, property owners can become increasingly dependent on federal flood insurance and other residual mechanisms.
This creates another form of concentration risk:
Private Insurance Capacity ↓ → Public Backstop Dependence ↑
The problem becomes more acute when repeated losses increase premiums, deductibles, or coverage restrictions faster than property values and household incomes can absorb them.
Recovery Deficit — 5/5
This is the region’s defining weakness.
A major flood can produce:
Property Damage → Income Loss → Reduced Local Tax Revenue → Infrastructure Damage → Limited Local Recovery Capacity
Federal disaster assistance can be essential, but administrative processes, funding requirements, and reconstruction complexity can extend recovery timelines.
The resulting feedback can become:
Low Local Fiscal Capacity → Slow Recovery → Persistent Damage → Lower Property Values → Lower Tax Base → Even Lower Recovery Capacity
Multiplicative Risk
3 × 3 × 5 × 4 × 5 = 900
Total Risk Factor: 900
This produces an important result:
The Mississippi Delta scores lower than Coastal Texas in raw hazard exposure but higher in total multiplicative risk.
That is precisely why a multiplicative framework is useful.
A moderate physical hazard can produce extreme systemic risk when combined with high vulnerability and a severe recovery deficit.
5. Urban Northeast Corridor
The Legacy-Infrastructure and Urban-Flooding Zone
Hazard Exposure — 3/5
The urban Northeast faces:
Nor’easters + Extreme Rainfall + Tidal Flooding + Sea-Level Rise + Urban Flash Flooding
The region does not necessarily experience the most extreme individual climate hazards in the country.
Its risk derives from density, infrastructure age, and enormous concentrations of economic value.
Hazard Coupling — 4/5
A central pathway is:
Sea-Level Rise → Higher Coastal Baseline → Reduced Stormwater Drainage Capacity → Heavy Rainfall → Urban Flooding
The resulting flooding can affect:
Basements + Subways + Tunnels + Electrical Systems + Transportation Networks + Commercial Districts
This creates a particularly important urban cascade:
Extreme Rainfall → Stormwater Overload → Transit Disruption → Workforce Disruption → Business Interruption → Economic Loss
Vulnerability — 4/5
The region contains extraordinary quantities of legacy infrastructure and older real estate.
Many structures were designed under climate conditions substantially different from those now emerging.
Below-grade spaces can be especially vulnerable:
Basement Housing + Electrical Rooms + Subway Infrastructure + Underground Transportation
This makes the region highly sensitive to intense precipitation even when properties are not located directly adjacent to rivers or coastlines.
Insurance Stress — 3/5
Insurance remains more available than in the most stressed coastal and wildfire markets, but the trajectory remains important.
Increasing flood claims, basement losses, storm damage, and infrastructure disruption can gradually increase premiums and deductibles.
The principal concern is therefore not an immediate insurance-market collapse but gradual repricing of urban climate exposure.
The feedback is:
Urban Flood Risk ↑ → Claims ↑ → Insurance Costs ↑ → Cost of Ownership ↑ → Property-Value Pressure ↑
Recovery Deficit — 2/5
The Northeast possesses comparatively strong municipal tax bases, financial resources, infrastructure institutions, and access to federal resources.
This provides substantial recovery capacity.
However, the scale and age of infrastructure create long-term adaptation challenges.
The region’s primary weakness is therefore not immediate recovery capacity but the enormous cost of modernizing legacy systems before they become repeatedly overwhelmed.
Multiplicative Risk
3 × 4 × 4 × 3 × 2 = 288
Total Risk Factor: 288
The Urban Northeast demonstrates that high population density and high property values do not automatically produce the highest multiplicative risk.
Strong fiscal and institutional recovery capacity can substantially reduce systemic risk.
Real-Estate Climate Risk Comparison Matrix
The following matrix applies the five-factor multiplicative framework:
| Region | Hazard Exposure | Hazard Coupling | Vulnerability | Insurance Stress | Recovery Deficit | Multiplicative Risk |
|---|---|---|---|---|---|---|
| 1. Gulf Coast & Southern Florida | 5 | 5 | 4 | 5 | 4 | 2,000 |
| 2. California WUI | 4 | 5 | 4 | 5 | 4 | 1,600 |
| 3. Mississippi River Delta & Inland Waterways | 3 | 3 | 5 | 4 | 5 | 900 |
| 4. Coastal Texas | 4 | 4 | 4 | 4 | 3 | 768 |
| 5. Urban Northeast Corridor | 3 | 4 | 4 | 3 | 2 | 288 |
Why the Ranking Matters
The ranking demonstrates why climate-driven real-estate risk cannot be measured solely by the severity of weather.
The Mississippi Delta provides the clearest example.
Its 3/5 hazard-exposure score is lower than Coastal Texas’s 4/5, yet its overall multiplicative score is higher:
Mississippi Delta → 900
Coastal Texas → 768
The difference arises from the interaction of:
High Vulnerability + High Insurance Stress + Severe Recovery Deficit
This is the essence of cascading risk.
A region does not need to have the most extreme weather to have the greatest systemic vulnerability.
It needs to have the most dangerous combination of interacting weaknesses.
The Central Insurance Feedback
Across the five regions, insurance functions as one of the primary transmission mechanisms connecting physical climate risk to real-estate values.
The feedback can be represented as:
Climate Risk ↑ → Expected Losses ↑ → Insurance Claims ↑ → Premiums ↑ → Deductibles ↑ → Coverage Restrictions ↑ → Insurance Availability ↓ → Cost of Ownership ↑ → Property Demand ↓ → Property Values ↓
Once property values begin declining, another feedback can emerge:
Property Values ↓ → Mortgage Collateral ↓ → Lending Risk ↑ → Financing Constraints ↑ → Buyer Pool ↓ → Property Liquidity ↓ → Property Values ↓
Insurance therefore does not merely compensate property owners after losses.
It can influence whether a property can be:
Owned → Financed → Sold → Developed → Maintained → Insured
This makes insurance availability and affordability a critical component of real-estate climate risk.
The Major Coupled Feedback Loops
1. Insurance–Property Value Feedback
Climate Risk ↑ → Insurance Losses ↑ → Premiums ↑ / Availability ↓ → Cost of Ownership ↑ → Buyer Demand ↓ → Property Values ↓
2. Property Value–Tax Base Feedback
Property Values ↓ → Tax Base ↓ → Municipal Revenue ↓ → Infrastructure Investment ↓ → Resilience ↓ → Flood Risk ↑ → Property Values ↓
3. Recovery-Deficit Feedback
Disaster Frequency ↑ → Recovery Window ↓ → Unresolved Damage ↑ → Vulnerability ↑ → Next-Event Losses ↑ → Recovery Window ↓
4. Insurance–Mortgage Feedback
Physical Risk ↑ → Insurance Stress ↑ → Coverage Constraints ↑ → Mortgage Risk ↑ → Lending Constraints ↑ → Buyer Pool ↓ → Property Values ↓
5. Commercial Real-Estate Feedback
For income-producing properties:
Climate Risk ↑ → Insurance + Maintenance + Adaptation Costs ↑ → Operating Expenses ↑ → NOI ↓ → Property Value ↓
This relationship is particularly important for multifamily, hospitality, retail, industrial, and other income-producing properties.
The Cascading Real-Estate Framework
The five regional examples reveal several recurring stages in the emerging climate-real-estate cascade:
Physical Hazard
Warming → Sea-Level Rise + Heavier Rainfall + Stronger/Slower Storms + Extreme Heat + Drought
Hazard Coupling
Multiple Hazards → Compound Events → Greater Physical Exposure
Property Damage
Compound Hazard → Structural Damage + Infrastructure Damage + Business Interruption
Insurance Stress
Losses ↑ → Premiums ↑ + Deductibles ↑ + Coverage Restrictions ↑ + Availability ↓
Property Repricing
Insurance Cost ↑ → Cost of Ownership ↑ → Buyer Demand ↓ → Property Values ↓
Financial Amplification
Property Values ↓ → Mortgage Risk ↑ + Investment ↓ + Liquidity ↓
Municipal Amplification
Property Values ↓ → Tax Base ↓ → Infrastructure Investment ↓
Resilience Erosion
Infrastructure Investment ↓ + Recovery Capacity ↓ → Vulnerability ↑
Cascading Risk
Vulnerability ↑ → Future Losses ↑ → Insurance Stress ↑ → Property Values ↓
The resulting closed-loop system is:
Climate Hazard → Physical Loss → Insurance Stress → Property-Value Decline → Investment Decline → Tax-Base Erosion → Infrastructure Deterioration → Recovery Deficit → Greater Vulnerability → Greater Future Loss
The Central Finding
The Multiplicative Climate Risk framework produces a fundamentally different understanding of climate-exposed real estate.
The highest-risk region is not necessarily the region with:
The Most Hurricanes
The Most Wildfires
The Most Rainfall
or
The Highest Sea-Level Rise
Instead, it is the region where multiple risk factors interact:
Hazard Exposure × Hazard Coupling × Vulnerability × Insurance Stress × Recovery Deficit
The resulting system can become self-reinforcing:
Climate Hazard → Insurance Stress → Property-Value Decline → Investment Decline → Tax-Base Erosion → Infrastructure Resilience Decline → Recovery Deficit → Greater Vulnerability → Greater Future Loss
This is the central transition from climate hazard to cascading real-estate risk.
The most consequential property-market question is therefore no longer simply:
Will this property flood, burn, or be damaged by extreme weather?
It is:
Can this property remain insurable, financeable, valuable, maintainable, and economically viable as climate hazards become more frequent and increasingly coupled?
That question shifts climate-risk analysis from the physical event itself to the long-term resilience of the economic system surrounding the property.
And that is where the greatest risks may emerge.
The weather creates the shock.
Coupled hazards amplify the shock.
Insurance translates the shock into financial cost.
Real estate capitalizes the cost into property values.
Weak recovery capacity allows the damage to accumulate.
And cascading feedbacks can turn a climate hazard into a real-estate crisis.
Coupled Climate Feedbacks and Cascading Real Estate Risk
More Insurance Coverage
Extreme Impacts: Extreme Weather Events | Violent Rain | Deadly Humid Heat | Sea Level Rise | Insurance
Ecosystems & Feedbacks: Ecosystem Collapse & Extinction Risks | Soil–Insect Climate Feedback Collapse | Insect Collapse | Soil | Trees & Deforestation
Human Health & Society: Climate Change Business & Economics | DIY Climate Control | Climate & Human Health | Climate Tax | Limits of Human Adaptability | Climate-Driven Health Collapse | Food & Water Security | Civilization Collapse